

A DDGS nutrient analysis provides more than average crude protein and fat figures—it reveals a feed ingredient whose true feeding value hinges on the ethanol production processes behind it. For livestock nutritionists and feed formulators, understanding how corn quality, fermentation, and drying conditions dictate protein digestibility and fiber profile is essential to making sound purchasing decisions. In over fifteen years of integration work between ethanol plants and livestock operations, I have seen that DDGS is significantly undervalued when its quality is assured through controlled processing and transparent data sharing. This article goes beyond typical lab reports to examine what a DDGS nutrient analysis should deliver: practical insights into protein quality, fiber composition, mineral load, and risk management for consistent ration formulation.
What Does DDGS Nutrient Analysis Tell Livestock Producers?
At its simplest, DDGS from corn ethanol plants averages 27-30% crude protein, 8-12% crude fat, and 7-10% crude fiber on a dry matter basis. But the real message of a nutrient analysis is not the single number on a certificate; it is the range and what drives that range. The corn feedstock used—whether field corn, wet corn, or corn that has undergone mycotoxin stress—sets the baseline. Then fermentation efficiency, the amount of distillers solubles blended back, and the drying conditions all shift the final analysis. I have encountered nutritionists who blindly applied the same DDGS matrix values across suppliers and seasons, only to find that actual amino acid digestibility had drifted, costing them feed conversion. A thorough nutrient analysis is less about a static label and more about understanding the production chain that produced the batch.
A typical DDGS nutrient profile looks like the following:
| Nutrient | Typical Range (Dry Matter Basis) |
|---|---|
| Crude Protein | 27-30% |
| Crude Fat | 8-12% |
| Neutral Detergent Fiber (NDF) | 25-35% |
| Phosphorus | 0.7-1.0% |
| Sulfur | 0.4-0.8% |
| Lysine (as percent of CP) | 2.6-3.3% |
These averages mask the variability that can push lysine availability or energy values outside comfortable formulation windows, especially for monogastric species. The following sections explore where that variability originates and how to manage it.
How Does Ethanol Processing Shape DDGS Protein Quality?
The protein fraction of DDGS is primarily zein and glutelins from corn, but its true nutritional value lies in the amino acid profile—and specifically the availability of lysine, methionine, and threonine. In a well-controlled ethanol plant, protein quality remains high. However, if drying temperatures exceed 500°F or if the material resides too long in the dryer, Maillard reactions bind lysine to sugars, rendering it indigestible. Even when total crude protein looks acceptable, lysine digestibility can fall from 75-80% to below 60%, severely limiting the use of DDGS in swine and poultry feeds.
In our work integrating ethanol facilities with livestock farms, I have observed that a reduction in dryer temperature from around 600°F to 450°F can improve available lysine by 10-15 percentage points. Plant operators who monitor the lysine:crude protein ratio (Lys:CP) as a drying quality metric—targeting above 3.0%—consistently produce DDGS that nutritionists trust. Yet many facilities still prioritize ethanol yield and throughput over feed quality, often because the connection between dryer settings and livestock performance is not obvious on the plant floor. Process integration between ethanol and feed teams is therefore not just a technical detail; it is a quality control strategy.
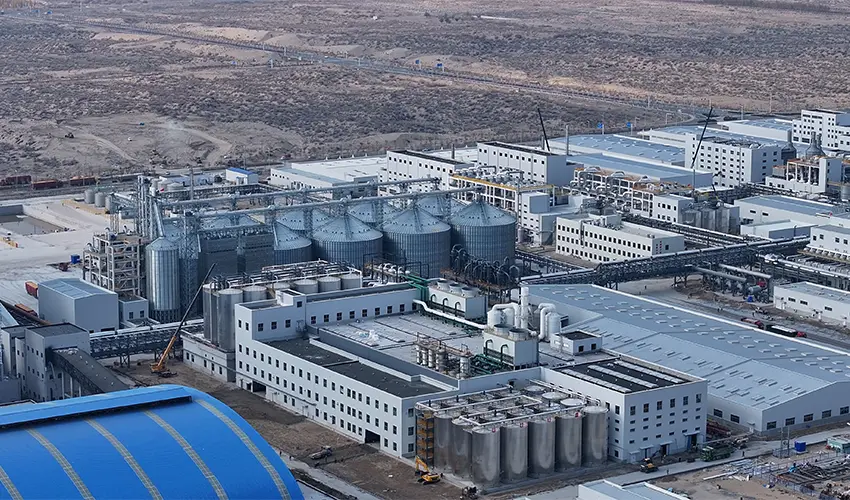
AGRIFAM’s integrated alcohol production approach, built on a circular “corn-food-energy-feed” model, embeds that connection from the start. When ethanol plants are designed with feed quality as a co-equal product line, drying parameters and syrup blending are managed with the end-user’s formulation needs in mind, not solely ethanol output.
Why Does Lysine Availability Vary So Much Between DDGS Batches?
Lysine is the first limiting amino acid in many swine and poultry diets, so its availability in DDGS can make or break a ration’s economics. The primary driver of lysine variability is heat exposure during drying. The darker and more caramelized a DDGS sample appears, the more likely that available lysine has been sacrificed. Additional factors include the corn variety (some have more fermentable starch but less bound lysine), fermentation time, and the amount of condensed distillers solubles added post-distillation—excess solubles can increase sulfur and reduce lysine concentration proportionally. Regular testing of Lys:CP ratio, not just total protein, is the only way to know whether a batch will perform as expected.
How Drying Temperature Affects Protein Digestibility
Drying reduces moisture to about 10% for stable storage, but it also denatures proteins. At temperatures above 480°F, the rate of Maillard reactions accelerates, particularly when residual sugars are high. Many DDGS drying systems use rotary drum dryers that can develop hot spots, causing variable lysine damage even within a single batch. A practical metric for feed buyers: if the Lys:CP ratio falls below 2.8%, the DDGS is likely heat-damaged and will underperform in amino-acid-sensitive rations. When I visit an ethanol plant with integrated feed operations, I look first at their dryer temperature logs, not just their protein average.
Why Does Fiber Digestibility in DDGS Matter for Diet Energy?
The fiber in DDGS, measured as NDF and ADF, is a double-edged sword. For ruminants, NDF provides a slow-release energy source and supports rumen function. In dairy rations, DDGS NDF of 30-35% contributes to effective fiber while delivering highly digestible protein and fat. But for monogastric animals like pigs and poultry, high NDF lowers net energy and can reduce feed intake. NDF in DDGS ranges from 25 to 40% depending on how much corn oil and pericarp are removed during fermentation and whether oil extraction is performed prior to ethanol production. When ethanol plants add back solubles rich in fat, they dilute fiber, but some modern plants partially extract corn oil, leaving a higher-fiber DDGS. This is not always reflected in the typical “average” nutrient table.
Feed formulators working with poultry often ask: how do I account for fiber variability? The answer starts with asking your DDGS supplier for NDF values specific to each shipment, not just historical averages. I have seen layer operations where a mid-summer switch to a higher-fiber DDGS source, without adjusting formulation net energy, led to measurable drops in egg weight. Supplementing with enzymes like xylanase and cellulase can offset some of the anti-nutritional effects of fiber, but it is far cheaper to select DDGS with NDF consistently in the 27-30% range if you are feeding high-producing animals.
Why NDF and ADF Differ and Their Impact on Monogastric Diets
ADF (acid detergent fiber) represents the less digestible cellulose and lignin fraction, while NDF includes hemicellulose as well. In DDGS, ADF is typically 12-16%. Because monogastric animals lack the enzymes to digest cellulose, higher ADF directly means less available energy. When I compare two DDGS samples with similar protein but one has ADF of 18% and the other 13%, the latter will usually provide 50-80 kcal/kg more metabolizable energy for swine—enough to noticeably shift feed cost per unit gain. Always request ADF data in addition to crude fiber, which is a poor predictor of true fiber effects.
If your program involves high-inclusion DDGS in finisher pig or broiler diets, it is worth confirming the ADF and NDF values of each load before finalizing your formulation matrix. Our integrated supply arrangements at AGRIFAM provide lot-specific fiber data, so nutritionists can dial in energy precisely. Send your target fiber profile to [email protected] and we can help align a DDGS source with your digestibility requirements.
Managing Fiber When Using DDGS in Poultry and Swine Diets
For poultry, a rising-NDF DDGS forces higher fat supplementation to maintain energy, which increases cost. In swine, high-fiber DDGS reduces dressing percentage slightly but can be managed by limiting inclusion to 20% in finisher rations. The key is using an ingredient matrix that dynamically reflects NDF, not just an average. Contemporary feed formulation software can incorporate NDF and ADF values and adjust energy prediction, but this only works if the data are available. Most ethanol plants can produce these numbers; few are asked to provide them consistently. The nutrient analysis is only as useful as the parameters you request.
What Mineral Challenges Come with Using DDGS in Livestock Feed?
DDGS concentrates minerals from corn threefold, so phosphorus, sulfur, and to a lesser extent potassium and magnesium become significant. Phosphorus in DDGS (0.7-1.0%) is predominantly in phytate form, which monogastric animals cannot digest without phytase enzymes. Ruminants, with microbial phytase in the rumen, fare better, but oversupplying phosphorus still leads to excretion and potential environmental runoff issues. Sulfur content, typically 0.4-0.8%, poses a more immediate threat: in cattle, total dietary sulfur above 0.4% of dry matter can induce polioencephalomalacia (PEM), especially when water sulfur is also high. I have advised beef feedlot managers to cap DDGS inclusion at 20-25% when total sulfur from all sources approaches the critical threshold.
The table below illustrates typical mineral values and their implications:
| Mineral | Typical DDGS Content (DM) | Main Concern |
|---|---|---|
| Phosphorus | 0.7-1.0% | Excess in manure; phytase responsive |
| Sulfur | 0.4-0.8% | Toxicity risk in ruminants |
| Potassium | 1.0-1.5% | Can increase wet litter in poultry |
| Sodium | 0.2-0.5% | Generally not limiting |
For swine and poultry, using dietary phytase is standard practice to liberate phosphorus, reducing the need for inorganic phosphate supplementation. In dairy rations, the high phosphorus in DDGS must be balanced against the risk of elevated fecal phosphorus and regulatory limits. Integrated livestock and ethanol operations can close this loop: manure nutrients from animals fed DDGS can be returned to corn production, but only if phosphorus is managed precisely.
How Can Nutrient Analysis Detect Heat Damage and Mycotoxin Risk in DDGS?
Routine proximate analysis (moisture, protein, fat, fiber, ash) will not flag heat damage or mycotoxin presence. For heat damage, the Lys:CP ratio is the most practical indicator. I recommend requiring it from suppliers as a condition of purchase for monogastric feeds; a value below 2.8% suggests excessive heating and reduced amino acid availability. Visual color charts are widely available but subjective. A lab test for reactive lysine is better, but the Lys:CP ratio correlates well and is cheaper to run.
Mycotoxins, particularly aflatoxin, deoxynivalenol (vomitoxin), and zearalenone, can be concentrated in DDGS relative to the original corn. Because fermentation does not destroy all toxins and drying only partially reduces some, DDGS can carry 2-3 times the mycotoxin load of incoming grain. A comprehensive quality program includes random sampling and ELISA or HPLC testing for multiple toxins. When I have helped feed mills set up supplier qualification protocols, the ones that reduced mycotoxin-related production losses always insisted on batch-level testing results, not just a single annual certificate.
Using the Lysine:Crude Protein Ratio as an Early Warning
A Lys:CP ratio below 2.8 often signals heat damage, but it can also indicate that less solubles were added back after distillation, altering the amino acid balance. Context matters. If the Lys:CP ratio is low but the color is light and the dry matter is normal, the cause may be under-addition of solubles rather than overheating. Regardless, the ratio is a quick screening tool. When I evaluate a new DDGS source, I ask for a trending chart of Lys:CP over the past 12 months—if the data fluctuate widely, the plant lacks process consistency and I would hesitate to contract large volumes.
Practical Sampling and Testing for Reliable DDGS Quality
Quarterly, grab a dozen sub-samples from different locations in the load and composite them. Test for moisture, protein, fat, fiber, and Lys:CP as a minimum. If targeting nursery pigs or broiler starters, add a mycotoxin panel. I have seen operations save tens of thousands of dollars in feed costs by catching a hot batch before it entered the silo. AGRIFAM’s quality assurance model includes these data as part of our supply agreements, so nutritionists receive not just a certificate but a process context. If your DDGS supplier cannot or will not provide batch-specific Lys:CP and mycotoxin data, consider that a red flag.
How Should You Formulate Livestock Diets Using DDGS Nutrient Data?
DDGS inclusion is limited not by its nutritional potential but by the secondary constraints it imposes: phosphorus load, sulfur load, fat rancidity over time, and potential feed intake depression from fiber. In practice, maximum recommended inclusion levels (as-fed basis) are:
| Species | Typical Inclusion Range | Limiting Factor |
|---|---|---|
| Swine (finisher) | 15-30% | Lysine availability, carcass fat quality |
| Broilers | 5-15% | Fiber, feed intake, pellet quality |
| Layers | 10-20% | Feed intake, egg weight |
| Dairy cows | 10-20% | Sulfur, phosphorus balance |
| Beef feedlot | 20-40% | Sulfur toxicity, protein oversupply |
The most successful DDGS users treat it not as a single fixed ingredient but as a set of nutrients that require updating with each delivery. I advise maintaining a dynamic formulation matrix where crude protein, amino acids (digestible basis), fat, NDF, and available phosphorus are updated from the supplier’s certificate of analysis. When done consistently, DDGS can displace significant amounts of soybean meal and corn, often reducing ration cost by $15-25 per ton in swine diets at current ingredient prices.
Balancing Minerals to Meet Manure and Environmental Regulations
In many regions, the high phosphorus content of DDGS directly adds to manure phosphorus loading, which is capped by nutrient management plans. To use DDGS at high levels while staying compliant, nutritionists must lower inorganic phosphate addition or adopt a phytase strategy that effectively frees phytate phosphorus. For cattle feedlots, sulfur is the bigger challenge; the combination of DDGS, water sulfates, and corn gluten feed can push total sulfur over the 0.4% threshold. When our team formulates with DDGS from AGRIFAM-integrated plants, we track the water sulfur analysis and adjust inclusion accordingly—a practice that has prevented PEM outbreaks on multiple occasions.
DDGS from ethanol plants that treat feed as a primary product, not a byproduct, can provide a stable, economical ingredient that supports both high performance and environmental goals. The key is a nutrient analysis program that does more than check the protein box; it examines the factors that determine whether that protein and energy will actually reach the animal.
Inconsistent DDGS quality leads to unpredictable livestock performance, forcing nutritionists to over-formulate safety margins and leaving money on the table. At AGRIFAM, we integrate ethanol and livestock operations so that DDGS is produced with the same attention to quality as the ethanol itself. If you are sourcing DDGS and need a reliable nutritional partner, send your target amino acid profile, fiber tolerance, and mycotoxin thresholds to [email protected] or call 010-8591 2286. We match your requirements with lot-specific data from integrated facilities, so your rations perform as designed.
Common Questions About DDGS Nutrient Analysis
How does DDGS compare to soybean meal in amino acid profile?
Soybean meal has a higher lysine content (about 3.0% vs 0.8-1.0% in DDGS) and a more balanced amino acid profile for monogastrics. However, DDGS contributes energy from fat and fiber, making the two complementary rather than directly interchangeable. In swine diets, I typically use DDGS to supply 40-60% of the supplemental protein and cover the rest with soybean meal and synthetic amino acids. The energy contribution of DDGS often reduces the need for added fat by 1-2%, which can offset the cost of additional soybean meal.
What is a safe maximum inclusion rate for DDGS in broiler diets?
Most broiler integrators limit DDGS to 10-15% in grower diets. At 20% or above, feed intake can drop due to fiber bulk, and pellet quality may suffer. Aflatoxin and vomitoxin concentrations also need careful monitoring. The safe maximum therefore depends on the actual NDF and mycotoxin content of each batch. There is no universal number, which is why I always insist on lot-specific analysis from the supplier before committing to a high-inclusion program.
Can I use DDGS alone as the protein supplement for dairy cows?
DDGS is an excellent protein source for lactating cows, providing rumen undegradable protein and digestible fiber, but it should not be the sole protein supplement. Its high phosphorus content can disturb the calcium-to-phosphorus ratio if used at very high levels. I generally recommend balancing DDGS with canola meal or soybean meal to maintain a Ca:P ratio near 1.5:1 to 2:1. Additionally, when water already carries sulfates, total dietary sulfur must stay below 0.4% dry matter to avoid PEM.
How can I test whether a DDGS supplier delivers consistent quality?
A consistent supplier will provide batch-specific data on moisture, protein, fat, NDF, ADF, Lys:CP ratio, and mycotoxin screening. If you only receive a one-page generic specification, quality is probably variable. I have learned to ask for six months of historical data: erratic Lys:CP or NDF numbers signal inconsistent drying or syrup addition. If you are evaluating a new DDGS source and need guidance on what to request, send your typical consumption volume and species profile to [email protected]. We help establish meaningful quality benchmarks so your formulations stay reliable.
If you’re interested, check out these related articles:
Driving Global Food Conservation Through Technological Innovation