
Ethanol plant energy efficiency directly determines whether a dry mill facility operates at a profit or struggles with margins. Across the fifteen years I have spent designing and commissioning grain-based alcohol projects in multiple countries, the plants that consistently deliver a 25% lower energy intensity than industry averages share one trait: they treat energy not as a utility to be supplied but as a resource to be circulated. A facility burning 30,000 BTU per gallon of ethanol may have the same distillation columns and molecular sieves as one consuming 22,500 BTU per gallon; what separates them is how thoroughly heat integration, biogas recovery, and real‑time digital control have been engineered into a single closed-loop system.
Energy Efficiency Hotspots in Ethanol Plants
Before discussing reduction strategies, the energy balance of a modern corn ethanol plant must be understood as a system of interconnected nodes, not a collection of independent unit operations.
| Process Stage | Share of Total Energy Use | Primary Energy Type | Typical Reduction Levers |
|---|---|---|---|
| Distillation & dehydration | 45–55 % | Thermal (steam) | Heat integration, vapour recompression, molecular sieve regeneration optimization |
| DDGS drying | 15–20 % | Thermal (steam/gas) | Indirect drying, waste heat from distillation, biogas substitution |
| Evaporation (stillage) | 10–15 % | Thermal (steam) | Multiple‑effect evaporation, mechanical vapour recompression |
| Liquefaction & saccharification | 8–12 % | Thermal & electrical | Enzyme performance at lower temperatures, heat recovery from cooling |
| Fermentation cooling | 5–8 % | Electrical | Process water recycling, cooling tower efficiency |
| Auxiliary systems (lighting, pumps, air) | 3–5 % | Electrical | Variable frequency drives, intelligent motor control |
The largest leverage point sits in distillation and dehydration, where a modest 10 % improvement in thermal efficiency translates into a site‑wide energy reduction of 4–6 %. Because these stages dominate the steam load, any project that addresses them without simultaneously evaluating the downstream opportunities in DDGS drying and evaporation will leave the largest savings untapped.
Heat Integration for Ethanol Plant Energy Efficiency
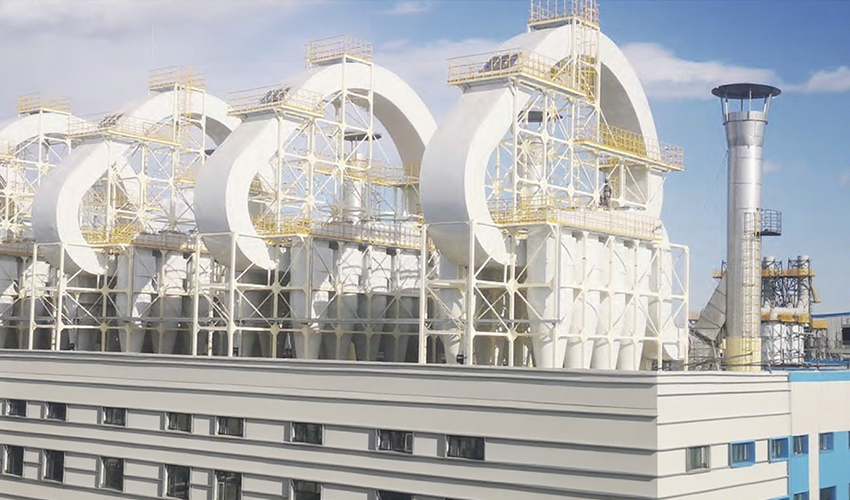
Distillation columns discharge enormous quantities of low‑grade heat through their overhead vapours and bottoms product. In a plant without integration, that heat is rejected to cooling towers and lost. When energy cascade principles are applied from the design phase, the same heat is redirected to replace live steam in upstream and downstream processes.
A well‑integrated cascade typically follows this structure: distillation overhead vapours, at roughly 80–95 °C, are passed through a falling‑film evaporator to pre‑concentrate thin stillage before it enters the main evaporator train. The resulting condensate, still near 90 °C, becomes process water for the mash preparation step, reducing the steam demand in the cook system. Meanwhile, the DDGS dryer – often the second‑largest thermal consumer – can be fed with flue gas from a biogas‑fired boiler rather than a dedicated natural gas burner. In one project I reviewed, rerouting distillation waste heat to the evaporators cut the plant’s total live steam consumption by 18 % without adding a single new piece of major equipment. The challenge is not the availability of heat; it is the piping and control logic that allow the heat to arrive at the right temperature, at the right time, and in the right sequence across multiple unit operations.
Closing the Loop with Waste Heat Recovery and Biogas Utilization
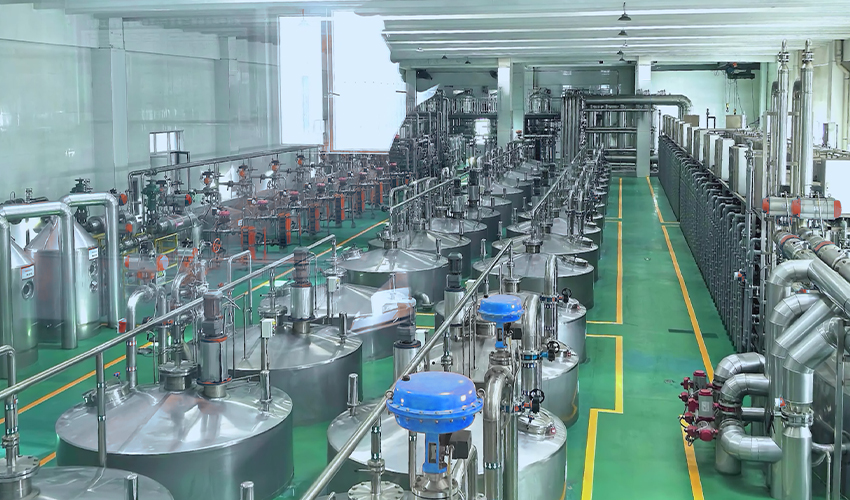
Waste heat recovery alone does not achieve a 25 % reduction; it must be paired with a biogas programme that converts the plant’s organic waste streams into usable fuel. Every dry mill ethanol plant produces a high‑strength wastewater fraction from its stillage handling system. When this stream is routed through an anaerobic digester, the chemical oxygen demand is reduced while methane‑rich biogas is generated. That biogas can be scrubbed and injected directly into a boiler or duct burner, displacing a portion of the purchased natural gas.
The closed‑loop behaviour emerges when the biogas plant, the boiler house, and the dryer are designed as a single thermal unit rather than three separate packages. Biogas fired in a high‑efficiency boiler produces steam for the distillation columns; the distillation waste heat then pre‑heats the dryer intake air or the evaporator feed. The solids from the digester become a soil amendment that returns organic matter to agricultural land, closing the nutrient cycle as well. At a facility where our team evaluated the full energy balance, coupling biogas production with a structured heat cascade brought the plant’s fossil fuel intensity down by 23 % on a per‑gallon basis, with the remainder coming from digital optimisation.
Digital Control Systems for Real‑Time Energy Management
Even the best‑designed heat integration network will drift off its design point within a few months of commissioning if it is not governed by a digital management platform that monitors energy flows in real time. A modern DCS‑based system collects data from steam flow meters, temperature transmitters, and power monitors at every major energy interface. The platform then compares actual consumption against the plant’s energy model and alerts operators when a deviation exceeds a set band.
I have observed a recurring pattern: a distillation column that was perfectly balanced during performance testing gradually loses its thermal efficiency because a level control valve is hunting, or a pressure transmitter has drifted. Without a digital platform, the additional steam consumption may go unnoticed for an entire quarter. With one, the anomaly is flagged within the same shift. Over a twelve‑month operating period at a 50‑million‑gallon plant, real‑time tracking of steam‑to‑ethanol ratio and specific electrical consumption typically identifies 3–5 % of energy loss that would otherwise be absorbed into the budget as “normal variation.” This is not a one‑time gain: the control system institutionalises the efficiency so that it becomes the new baseline.
Achieving a 25 % Energy Reduction in Ethanol Plants
If a plant is starting from a conventional design with little integration, a structured programme that combines the measures described above can realistically cut total energy consumption by one‑quarter. The table below summarises the expected contribution from each lever based on engineering assessments from completed projects.
| Reduction Measure | Estimated Energy Saving (% of baseline) | Primary Impact Area |
|---|---|---|
| Distillation heat integration | 8–12 % | Thermal (steam) |
| Biogas‑to‑fuel substitution | 5–7 % | Thermal (dryer/boiler) |
| Multiple‑effect evaporation / MVR | 3–4 % | Thermal (stillage) |
| Real‑time digital energy management | 2–3 % | Electrical & steam |
| Variable frequency drives & pump optimisation | 1–2 % | Electrical |
| Cumulative (with interdependency adjustments) | 22–25 % | Entire plant |
The interdependency adjustment is critical: adding heat integration increases the available waste heat, which improves the biogas boiler’s efficiency, which in turn reduces the dryer’s reliance on natural gas. When these measures are implemented in isolation the combined saving falls short of 20 %. Engineered together, the system effect pushes the total toward 25 %. This is why integrated EPC delivery that treats the entire ethanol plant as one energy system, from grain receiving to product storage, consistently outperforms a piecemeal retrofit approach.
If your current operating data shows an energy intensity above 28,000 BTU per gallon, a 25 % reduction is within reach with the right combination of process redesign and digital oversight. Our engineering teams routinely perform detailed energy audits that map every stream’s temperature, pressure, and flow to build a custom cascade model. Share your most recent utility bills and a simplified process flow diagram at [email protected] or call 010‑8591 2286, and we will provide a preliminary savings estimate within two weeks.
Energy and Cost Questions Ethanol Producers Frequently Ask
How much energy does a typical dry mill ethanol plant consume?
The average dry mill in a temperate climate consumes roughly 28,000–32,000 BTU of thermal energy per gallon of denatured ethanol, plus 0.8–1.2 kWh of electricity. Steam for distillation and dehydration accounts for roughly half of that thermal load. Plants that have implemented full heat integration and biogas recovery can operate below 22,000 BTU per gallon, and the best performers I have seen run consistently in the 20,000–22,000 BTU range without sacrificing throughput.
Is a 25 % reduction realistic for an existing plant, or only for new builds?
Both are possible, but the cost structure differs. A greenfield plant can embed the cascade design from the first pipe rack, which adds roughly 8–12 % to the front‑end capital cost but pays back in under three years under most fuel ethanol price scenarios. Retrofits demand more careful sequencing because hot piping must be rerouted while production continues. I recommend starting with a detailed pinch analysis to identify the two or three changes that deliver the fastest return – often coupling distillation overhead heat to the evaporator train – and then phasing in biogas and digital controls over a planned two‑year programme.
What is the payback period for an energy cascade retrofit?
When the plant’s energy baseline is above 30,000 BTU per gallon and natural gas prices exceed $4 per MMBTU, a well‑scoped cascade retrofit typically pays back in 18 to 30 months. The exact figure depends on the available space for new heat exchangers, the condition of the existing steam system, and whether the site has an anaerobic digester already permitted. Projects that combine biogas utilisation with heat integration tend to have shorter paybacks because the biogas displaces purchased fuel directly.
How does biogas utilisation affect the plant’s carbon intensity?
Replacing natural gas with biogas from the plant’s own wastewater can reduce the carbon intensity of the ethanol by 15–20 g CO₂‑equivalent per megajoule, depending on the baseline grid mix and the methane capture efficiency of the digester. This reduction is increasingly valuable in markets that price carbon or require low‑carbon fuel standard certification. If your facility is targeting a specific CI score, share your current CI pathway and we can model the exact impact of adding biogas to your energy balance.
If you’re interested, check out these related articles:
Driving Global Food Conservation Through Technological Innovation