
A corn ethanol process flow diagram is rarely just a drawing sequence. It is the plant’s operating logic made visible, from the first truck or rail sample at grain receiving to the anhydrous ethanol tank and the DDGS load-out conveyor. The most useful diagrams treat the facility as one integrated material and energy system rather than a set of isolated unit operations. That perspective changes how grain cleaning, mash preparation, fermentation, distillation, dehydration, and by-product recovery are sized, sequenced, and controlled. In my design reviews, the difference shows first in steam balance and by-product value, long before it shows in the equipment list.
Corn Ethanol Process Flow Begins at Grain Receiving and Cleaning
At the receiving station, corn quality sets the ceiling for every downstream yield calculation. A process flow diagram should show the truck or rail unload path, the receiving pit, drag conveyor, bucket elevator, scalper, magnetic separator, destoner, and aspirator as one continuous sequence, not as isolated pieces. Moisture and foreign material are measured before the corn enters storage because wet corn above roughly 17 percent can bridge and spoil. In a dry-mill ethanol facility, grain passing 14.5 to 15.5 percent moisture usually handles best through hammer mill grinding and liquefaction. Receiving capacity has to match the plant’s continuous demand with enough running hours to cover morning peaks and rail switching without starving the slurry tank.
From a safety perspective, the diagram also has to mark dust collection points, explosion panels, and grounding. Corn dust is an explosive material, and a diagram that omits aspiration from elevators and transfer points hides a real operating risk. We have found that grain receiving is the section most often under-sized in preliminary layouts, because the number of trucks or wagons per day is counted without accounting for peak harvest arrivals.
Milling, Liquefaction, and Saccharification Prepare the Mash
After cleaning, the corn moves to a hammer mill where particle size distribution determines how fast starch gelatinizes and how well enzymes reach it. Milling too fine increases electrical load and can create fines that foam in fermentation. Milling too coarse leaves starch inside hard endosperm particles and lowers conversion. The process flow diagram should show the mill discharge, slurry tank, pH adjustment, alpha-amylase dosing, jet cooker, and liquefaction hold in sequence, with steam injection points and condensate returns.
Liquefaction runs at 85 to 95 degrees Celsius and pH 5.5 to 6.0. The purpose is to break starch granules into soluble dextrins before the mash reaches fermentation. The flow diagram needs to show the jet cooker steam line and the hold tube or vessel because the difference between 30 seconds and 90 seconds of residence time changes viscosity and enzyme demand. At saccharification, glucoamylase cleaves dextrins into fermentable glucose at 55 to 60 degrees Celsius. In many plants, saccharification overlaps with fermentation as simultaneous saccharification and fermentation, so the diagram should mark where enzyme is added and where the mash transfers to the fermenter.
| Process Stage | Primary Equipment | Key Control Point | Common Failure Mode |
|---|---|---|---|
| Grain receiving and cleaning | Scalper, magnetic separator, destoner, aspirator | Moisture and foreign material | Wet corn bridging, metal carryover |
| Milling and liquefaction | Hammer mill, slurry tank, jet cooker | Particle size, pH, residence time | High viscosity, starch conversion loss |
| Saccharification and fermentation | Saccharification tank, fermenter, yeast propagation | Temperature, pH, ethanol titer | Bacterial contamination, foam |
| Distillation | Beer column, rectifier, side stripper | Reboiler duty, tray stability | Ethanol loss in stillage |
| Dehydration and product storage | Molecular sieve beds, product coolers, storage tanks | Feed moisture, regeneration pressure | Water breakthrough, off-spec product |
Fermentation, Distillation, and Dehydration Define Product Quality
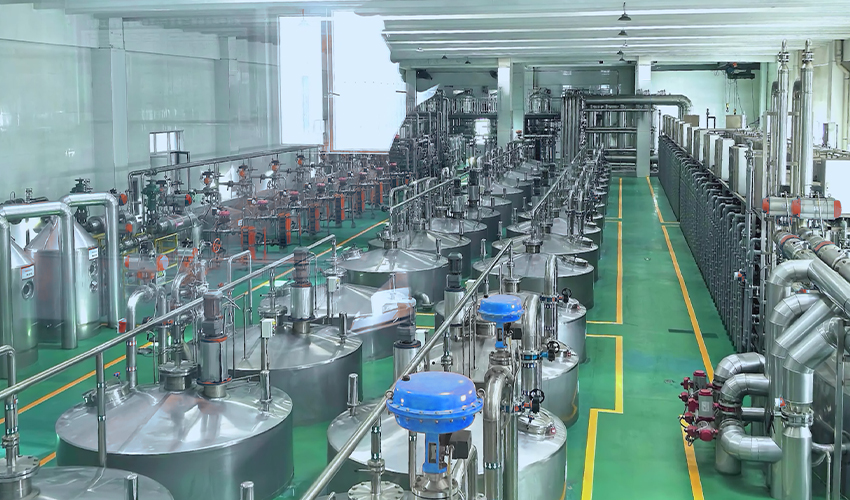
Fermentation is where the corn ethanol process flow diagram begins to show real product integration. Yeast propagation, fermenter cooling, pH control, and carbon dioxide venting are connected operations, not side notes. A typical dry-mill mash ferments at 30 to 34 degrees Celsius and reaches 12 to 15 percent ethanol by volume over 48 to 72 hours. The diagram should mark the CO2 scrubber because fermentation gas carries volatile organics and some ethanol, both of which can be recovered. Bacterial contamination is the main yield thief. It usually enters with the mash or through a poorly cleaned cooling circuit, and it shows up first as lactic acid and lower ethanol titer.
From fermentation, beer containing roughly 10 to 15 percent ethanol goes to distillation. The beer column strips ethanol from water and solids, the rectifier concentrates ethanol to about 95 to 96 percent, and side strippers recover entrained alcohol from thin stillage. At 95 to 96 percent, the mixture approaches the azeotrope, so ordinary distillation cannot finish the job. Dehydration with molecular sieve pressure swing adsorption removes the remaining water to reach anhydrous product, commonly 99.5 percent or higher for fuel grade ethanol. The process flow diagram has to show sieve feed coolers, regeneration gas, and condensate return because regeneration steam is a large part of total plant energy.
If your program involves a specific fuel ethanol specification or a high-moisture corn storage constraint, it is worth confirming the molecular sieve regeneration steam balance and the dryer capacity before the process flow diagram is frozen. Send your target capacity and corn specification to [email protected].
By-Product Recovery and Storage Complete the Corn Ethanol Process Flow
The corn ethanol process flow diagram does not end at the ethanol product line. Whole stillage from the beer column goes to centrifuges that separate wet grains from thin stillage. Thin stillage is concentrated in evaporators, combined with wet cake, and dried into DDGS. In the alcohol production systems AGRIFAM builds, the stillage path is designed alongside the ethanol path because DDGS drying can consume more steam than any two other sections combined. A diagram that shows only the product route misses the main energy and mass balance in the plant.
CO2 from fermentation can be scrubbed, compressed, dried, and liquefied into food-grade or industrial liquid carbon dioxide. This changes the plant from a single-product facility into a multi-product processing site. Biogas from anaerobic digestion of thin stillage or process wastewater can be sent to the boiler, reducing purchased fuel. Those loops are why the corn ethanol process flow diagram should not be drawn as a straight line from corn to ethanol.
Product storage is the final stage. Anhydrous ethanol moves to dedicated storage tanks with blanketing or floating roofs, flame arresters, overflow protection, and secondary containment. Denaturant blending for fuel ethanol happens before transfer to finished product tanks. The diagram should show custody transfer points, tank level control, and load-out pumps because this is where product volume, quality, and regulatory classification are fixed.
Engineering the Corn Ethanol Process Flow Into an Integrated System
A process flow diagram becomes a procurement list when the connections between steam, water, stillage, and by-product load-out are left out. That is where plants lose capacity and where operating cost hides. The difference between a workable plant and one that starts with reliability problems is usually not the main equipment itself. It is how the diagram handles return condensate, thin stillage recycle, vapor recovery, and tank farm logistics across shift changes.
We configure the complete grain-based alcohol and fuel ethanol line around the same integrated view. The scope can cover receiving, milling, liquefaction, saccharification, fermentation, distillation, dehydration, by-product recovery, storage, and commissioning as one engineering package. Send your planned annual capacity, corn moisture and starch specification, and target product grade to [email protected] or call 010-8591 2286. We will use those inputs to develop the block flow, utility balance, and main equipment list around your site conditions, not around an off-the-shelf template.
Common Questions Test the Corn Ethanol Process Flow Diagram
What is the difference between a block flow diagram and a process flow diagram for corn ethanol?
A block flow diagram shows the major process blocks and main material streams. A process flow diagram goes further. It adds stream numbers, temperature and pressure conditions, control valves, equipment tags, and the utility connections around each unit. For corn ethanol, the process flow diagram is the document that lets engineering teams size pipe, set relief cases, and plan operator rounds. I use the block flow for first capacity discussions and the process flow diagram for anything that touches steam, stillage, or safety.
Why does the corn ethanol process flow diagram have to include by-product handling?
A common mistake is to treat DDGS, CO2, and biogas as outside the process flow diagram. In a dry-mill corn ethanol plant, whole stillage and thin stillage are part of the same mass balance as ethanol. The diagram should show centrifuges, evaporators, the dryer, CO2 scrubbers, and biogas piping on the same sheet as distillation and dehydration. Leaving them off is how plants discover later that the dryer steam load or the wastewater return path was never integrated.
Where is molecular sieve dehydration placed in the corn ethanol process flow?
The more useful question is where the rectifier hands off water to the sieve. Molecular sieve dehydration sits after the rectifier and before product storage. The rectifier delivers ethanol at about 95 to 96 percent, which still contains enough water to be off-spec for fuel use. The sieve beds then remove the remaining water to reach anhydrous product. The flow diagram also has to show the regeneration loop, condensate return, and product coolers. If the diagram skips the regeneration path, the energy balance around dehydration will be wrong before the plant starts.
How much corn ethanol can a single dry-mill train produce?
It depends on the fermentation and distillation train. A single dry-mill train can be designed from roughly 50,000 tonnes per year up past 300,000 tonnes per year, but the practical ceiling is set by utility systems, tank farm, and DDGS drying capacity rather than by the columns alone. If your feasibility study is testing capacities in that range, it is worth confirming the steam balance, water treatment, and by-product load-out before finalizing the process flow diagram. Send your capacity target and product grade to [email protected] and we will confirm the block flow and main equipment list.
If you’re interested, check out these related articles:
Driving Global Food Conservation Through Technological Innovation