

Corn ethanol market analysis usually stops at national supply tables and headline price curves, but plant developers need a sharper question: will the margin hold after the plant is built? In our work across grain storage, alcohol process integration, and livestock feed chains, I have seen feedstock basis risk and co-product offtake decide projects more often than the ethanol price itself. This article reads supply, demand, and price trends through that plant-level lens, focusing on what changes the investment case for a new corn ethanol facility.
Corn Ethanol Market Supply and Feedstock Availability
Corn supply is the first variable in any ethanol market outlook, and it is rarely the national total that matters. Most feasibility models start with annual corn production and then miss the real constraint: storage condition and logistics at the plant gate. From our grain depot projects, the plants that hold up best are those where incoming corn moves through multi-stage cleaning, drying, and controlled silo storage before fermentation. That front-end control determines fermentable starch consistency far more than the average harvest report.
Feedstock basis risk is the gap between the benchmark corn price and the actual delivered cost. In my experience, this gap widens when regional grain circulation is tight, when rail or barge capacity is limited, or when storage infrastructure cannot buffer harvest-season pricing. A 100,000-tonne-per-year plant may need roughly 300,000 tonnes of corn annually, so a small basis move changes feedstock cost by millions, even when the national ethanol price does not move. The market supply number that deserves the most attention is therefore the deliverable surplus inside the plant’s own sourcing radius.
Fuel Ethanol Demand Drivers and Policy Signals
Fuel ethanol demand tracks policy more than price. Blending mandates set the base: a market with a rising ethanol blend ratio absorbs more supply even when gasoline demand is flat. For developers, the useful market analysis asks whether the mandate is enforceable, whether blending credits are stable, and whether import duties protect local producers. Those policy details determine whether a new plant competes on cost or simply serves a protected quota.
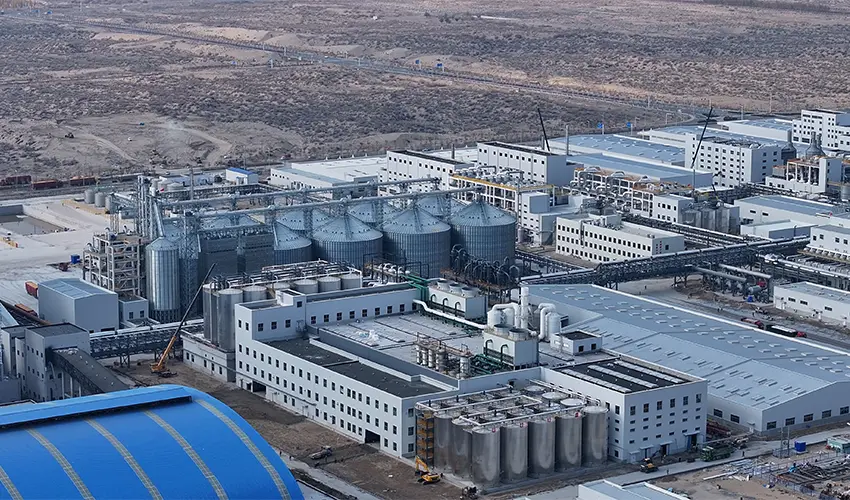
Blending Mandates and Import Policy
E10, E15, and E85 create different demand volumes and different supply chain requirements. E10 demand is the steadiest because it is tied to the general gasoline pool. E15 and E85 volumes depend more on flex-fuel fleet coverage, retailer adoption, and price incentives. We advise clients to model policy-approved demand separately from discretionary export demand, because the two carry different price risk. Import policy also matters where local production faces competition from lower-cost exporters.
Industrial and Export Demand
Beyond fuel blending, ethanol demand includes beverage, medical, and industrial solvent applications, but those markets are smaller and require separate product handling. A corn ethanol plant designed only for fuel grade may not be able to divert product to higher-value anhydrous or food-grade markets without additional purification. Export demand can be attractive during price spikes, but it adds logistics, quality specification, and counterparty risk that domestic blending contracts do not carry.
Corn Ethanol Market Price Forecast Scenarios Through 2026
Price forecasts are useful only when they are attached to a margin structure. Corn and ethanol prices move together over time, but not in lockstep, because energy costs, policy changes, and co-product markets intervene. The table below shows the scenarios we use in early project screening. Each scenario points to a different engineering response.
| Scenario | Feedstock trigger | Ethanol price behavior | Plant margin response |
|---|---|---|---|
| Stable policy | Regional corn basis holds within historical range | Ethanol tracks corn cost | Positive if co-product value steady |
| Tight feedstock | Local corn stocks drop after poor crop | Ethanol rises but lags corn | Margin compresses; storage advantage wins |
| Export disruption | Import duties or logistics shift demand | Regional price diverges from global | Plant with flexible product slate fares better |
| Energy price shock | Natural gas and fertilizer costs climb | Ethanol may rise with gasoline | Energy integration separates low-cost producers |
| Co-product demand rise | Livestock feed demand strengthens | Ethanol price effect muted | DDGS and corn oil margins offset pressure |

The key point is not the forecast itself but the contingency. The plants I have seen survive price cycles are those with feedstock storage, energy cascade, and by-product revenue already engineered into the plant, rather than treated as later add-ons.
Co-Product Economics and Plant Margin Structure
Co-products usually decide whether a corn ethanol plant is a good investment. Fuel ethanol alone is a commodity with tight margins; the same bushel of corn also yields distillers grains, corn oil, and carbon dioxide. In integrated alcohol projects, these streams turn what would be waste into revenue or internal energy. AGRIFAM’s alcohol EPC solution applies fermentation, distillation, and dehydration together with energy cascade utilization and biogas recovery, which changes the plant’s break-even point.
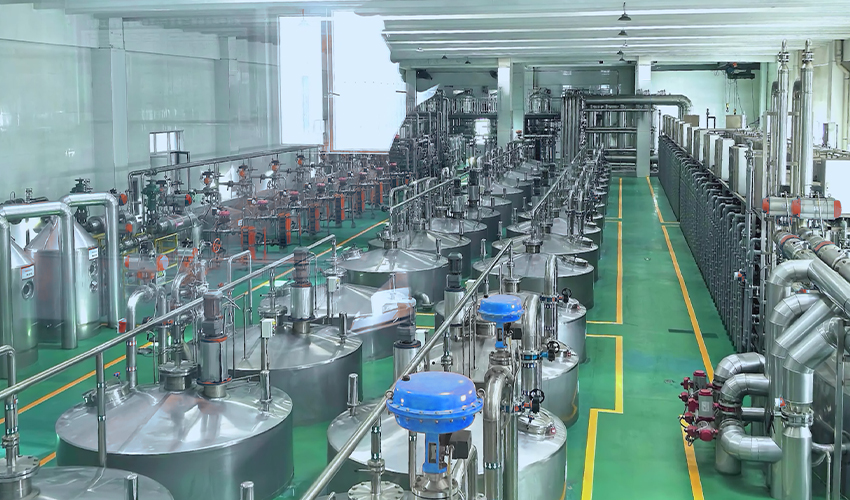
DDGS and Corn Oil Contributions
Distillers grains and corn oil are not by-products in our project planning; they are co-revenue lines. DDGS moves into livestock feed, and corn oil moves into feed or biodiesel. Their combined value can widen the crush spread enough to keep a plant profitable during a flat ethanol market. The useful market analysis prices these streams against local feed demand, not against a national average, because feed markets are regional and bulky to move.
Biogas and Carbon Dioxide Recovery
Anaerobic digestion of process wastewater can generate biogas for steam or power. Carbon dioxide from fermentation can be captured and purified for food or industrial use. These systems add capital cost, but they change the plant’s exposure to single-commodity ethanol pricing. If your project economics depend on co-product offtake, the margin structure is site-specific. Share your feedstock basis, co-product market assumptions, and utility rates and we can confirm which integration options fit your site. Reach me at [email protected].
Corn Ethanol Market Planning Around Price Volatility
Most corn ethanol market analysis stops at the forecast. A plant investment decision needs more: a capital plan that can tolerate price volatility before the first corn is ground. That means options in feedstock storage, flexible product switching, energy recovery, and by-product logistics. AGRIFAM works with agricultural clients to move from market study to an integrated plant plan, covering grain receiving, alcohol process, feed co-product handling, and energy systems.
If you are evaluating a corn ethanol plant or reworking an existing site, send your capacity target, location, and feedstock basis to [email protected] or call 010-8591 2286. We will check which integration options make the project work under your local market conditions.
Common Questions About Corn Ethanol Market Outlook
What is the most reliable margin signal in corn ethanol market analysis?
The most reliable margin signal is the co-product-adjusted crush spread, not the headline ethanol price. When you calculate revenue per bushel of corn, you add fuel ethanol, distillers grains, corn oil, and any captured carbon dioxide, then subtract net feedstock and energy cost. That number shows whether a plant can survive a flat ethanol market. A project that only breaks even on ethanol alone is more exposed to basis risk than a project with strong co-product cash flows.
Why do some corn ethanol plants stay profitable while ethanol prices fall?
A common mistake is treating ethanol demand as the only revenue driver. In most corn ethanol plants, distillers grains and corn oil contribute a meaningful share of total output value, and biogas can offset energy cost. If your market analysis does not price these streams, you will misjudge break-even by a wide margin. The more useful question is whether local feed and industrial gas markets can absorb these volumes at stable prices.
Should a new corn ethanol plant be designed for fuel grade only or multiple product grades?
It depends on whether your plant can divert ethanol between fuel, industrial, and beverage markets. A fuel-only plant has lower capital cost but fewer options when fuel margins weaken. A plant built with additional purification and dehydration capacity can serve multiple grades, but that flexibility raises initial investment. We usually model both paths before recommending one, because the right answer changes with local offtake and import policy.
What part of the corn ethanol supply chain most often surprises project developers?
In our project planning work, feedstock basis and storage have changed more project outcomes than the ethanol forecast. We have reviewed sites where the same corn zone produced very different delivered costs because of silo capacity, drying capability, and logistics access. That is why we start with grain receiving and storage design before locking the alcohol process. Send your capacity target and site details to [email protected] and we will confirm the feedstock and co-product options that fit your market.
If you’re interested, check out these related articles:
Driving Global Food Conservation Through Technological Innovation