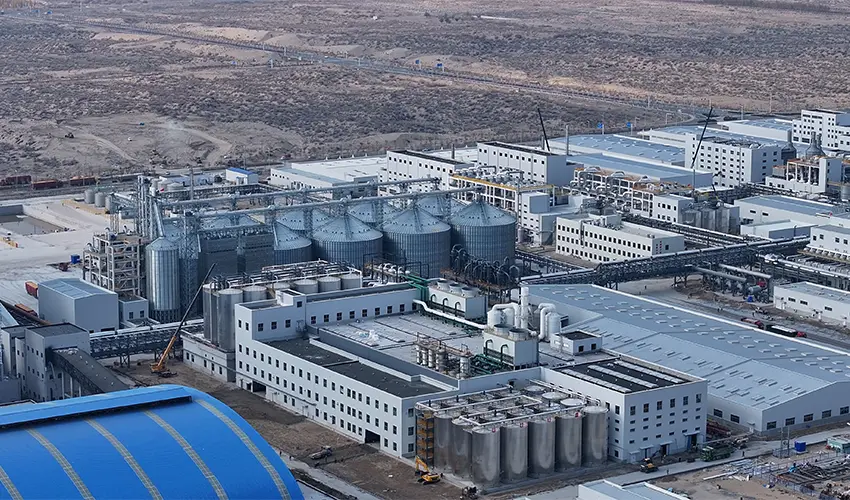

Fuel ethanol price trends depend on more than corn and oil—integrated plant design with by-product revenue can lower breakeven pricing by 15-20%, reducing market exposure. The price a fuel ethanol producer captures, and the margin they keep, are not simply gifts of the commodity markets. They are the result of a complex interaction of feedstock costs, energy prices, government mandates, and most critically, how the production facility itself is configured. Among the industry professionals I speak with—plant managers, procurement directors, project investors—there is a growing recognition that conventional approaches to tracking price trends miss the deeper story of plant-level economics. This article examines what actually moves ethanol prices, and why a facility designed for by-product valorization and energy integration can sustain profitability through market cycles that single-product plants cannot.
Key Forces Behind Fuel Ethanol Price Trends
Four broad forces set the baseline for fuel ethanol pricing. Feedstock is the most immediate: corn accounts for roughly 60-70% of the cost of producing a gallon of ethanol, so any movement in corn futures propagates directly into ethanol markets. Energy is the second large input, with natural gas and electricity needed for grinding, liquefaction, distillation, and dehydration. When crude oil prices rise, ethanol becomes more competitive as a gasoline blendstock, which can lift ethanol prices somewhat, but higher oil can also drag up natural gas costs, partially offsetting the benefit.
Supply and demand fundamentals are the third force. U.S. ethanol production capacity has largely stabilized, but seasonal variations in driving demand, export flows to markets like Canada, Brazil, and India, and stock levels all create price cycles within a year. Policy is the fourth and often the most unpredictable influence. In the U.S., the Renewable Fuel Standard mandates annual blending volumes, and the value of Renewable Identification Numbers (RINs) adds a direct financial layer to every gallon sold. When RIN prices spike, the effective return to ethanol producers improves even if the physical ethanol price does not move.
What many price analyses overlook is the amplifying or dampening effect of each plant’s operating cost structure on these external signals. A plant with high fixed costs and no co-product revenue feels a corn price spike differently than a plant where DDGS, corn oil, carbon dioxide, and biogas together contribute 20-30% of total revenue.
Corn and Crude Oil as the Twin Drivers of Ethanol Price Volatility
Corn and crude oil form the two-sided squeeze that defines ethanol plant margins. The corn-to-ethanol crush spread—the difference between the value of ethanol plus co-products and the cost of corn—is the industry’s margin metric. When corn is $4.50 per bushel and ethanol is $2.10 per gallon, the simple crush spread looks thin. But that calculation changes when a plant extracts corn oil for biodiesel feedstock, sells dried distillers grains with solubles (DDGS) into livestock feed markets, and captures carbon dioxide for food-grade or beverage applications.
The following table illustrates how a single-product plant and an integrated plant experience the same corn price differently:
| Cost/Revenue Item | Single-Product Plant ($/gal) | Integrated Plant ($/gal) |
|---|---|---|
| Feedstock (corn) | 1.40 | 1.40 |
| Net energy cost | 0.45 | 0.34 (25% heat recovery) |
| Other operating | 0.35 | 0.30 |
| Total cost | 2.20 | 2.04 |
| Co-product credit | 0.00 | 0.35 |
| Effective cost | 2.20 | 1.69 |
A drop in corn from $4.50 to $4.00 per bushel reduces the single-product plant’s cost by about $0.15 per gallon, whereas the integrated plant captures both the feedstock savings and the sustained co-product contribution, widening the margin gap. The dynamics with crude oil are similar: lower gasoline prices depress ethanol values, but plants that convert biogas to boiler fuel reduce their external energy exposure, preserving more margin when selling prices weaken.

The Role of Government Policy in Ethanol Pricing
Policy is not a backdrop; it is a direct price driver. The U.S. Renewable Fuel Standard sets annual obligations for obligated parties, creating a demand floor that underpins ethanol prices even when gasoline is cheap. RIN values amplify that support: an RIN price of $1.50 per gallon essentially adds that amount to the blender’s willingness to pay for physical ethanol. Brazil’s RenovaBio program, the EU’s Renewable Energy Directive, and India’s ethanol blending targets all function similarly in their respective markets.
Policy uncertainty, however, creates risk. Small refinery exemptions granted or withdrawn by the U.S. EPA can shift RIN demand by billions of gallons, causing rapid price swings. Tariff changes on ethanol exports suddenly reduce accessible markets, pushing product back into domestic supply. Plants designed with narrow operating margins are the most vulnerable to these policy shocks. An integrated facility drawing 20% of its revenue from non-ethanol co-products has a built-in stabilizer: a policy hit to ethanol pricing does not erase the entire cash flow.
If your current project feasibility assumptions rely on a single mandate or trade agreement, it is worth stress-testing how changes to that policy would affect plant payback. AGRIFAM’s engineering team routinely models multiple policy scenarios for clients during the project planning phase, which helps identify where margin buffers need to be built in from day one.
Integrated Plant Economics for Lowering Breakeven Against Price Swings
The most direct lever a producer has against price volatility is a lower breakeven cost. In conventional fuel ethanol plants, the focus is often on maximizing gallons and minimizing corn cost per gallon. A better question is: what is the net cost of corn after co-product credits? When that number drops from $1.40 to $1.05 per gallon, the plant’s breakeven ethanol price falls by a similar amount, and the volume of truly profitable weeks each year expands.
The model that I have seen work consistently across projects in China and internationally follows a “corn-food-energy-feed” circular economy loop. Corn enters the plant. Starch is converted to ethanol. The residual protein and fiber become DDGS for animal feed. Corn oil is separated for food or biodiesel. The CO₂ from fermentation is captured, purified, and sold to beverage or industrial users. Biogas from anaerobic digestion of process wastewater replaces a large portion of fossil fuel demand for steam and electricity.
At AGRIFAM, our alcohol plant designs apply energy cascade utilization to cut overall energy consumption by 25% compared to conventional plants. Process water is recycled in closed loops. The result is not just a sustainability story; it is a breakeven price that sits meaningfully below the market, producing positive cash flow even during price troughs that force single-stream plants to idle.
Future Outlook for Fuel Ethanol Prices
Looking ahead, several medium-term trends will shape ethanol prices. Global biofuel blending mandates are expanding: India targets 20% ethanol blending by 2025-26, and Brazil continues to flex between hydrous ethanol and gasoline based on sugar prices, creating dynamic demand for anhydrous ethanol exports. Aviation sustainable fuel (SAF) pathways that utilize ethanol as a feedstock could eventually add a premium demand tier. On the supply side, corn yields continue to rise, slowly easing the feedstock cost pressure.
The more actionable outlook for individual producers and investors is not a blanket price forecast, but a plant-level scenario analysis. A facility with a breakeven cost of $1.69 per gallon faces a fundamentally different set of future outcomes than one with a breakeven of $2.20. The integrated plant can withstand a longer period of low ethanol prices, stay operational while competitors idle, and capture the upswing with full capacity when margins recover. That resilience is not speculative; it is designed into the process flowsheet and the equipment selection.
Managing Ethanol Price Risk Through Plant Design
Price volatility in fuel ethanol markets will not disappear. But the degree to which it threatens a project’s financial viability is a function of how the facility is built. Corn and crude oil will continue to swing. Policy will continue to surprise. The difference between a marginal plant and a durable one is whether the revenue stack relies on a single commodity price or on a diversified output of ethanol, feed, oil, CO₂, and renewable energy.
At AGRIFAM, we support clients from feasibility through commissioning, building alcohol plants where energy integration, co-product monetization, and closed-loop water management are not afterthoughts but the core engineering framework. If you are evaluating a new fuel ethanol project or considering an upgrade to an existing facility, a customized assessment of your breakeven structure is the logical starting point. Send your project scope or part specifications to [email protected], or call 010-8591 2286 to speak with our engineering team.
Common Questions About Fuel Ethanol Price Trends
What are the main factors that affect fuel ethanol prices?
Fuel ethanol prices are driven primarily by corn feedstock costs, crude oil and gasoline prices, supply-demand balance, and government biofuel policies. Corn accounts for over 60% of production cost, so corn futures directly move ethanol prices. Crude oil influences ethanol’s competitive position as a gasoline blendstock. Meanwhile, seasonal driving demand, export volumes, and RFS mandates in the U.S. create shorter-term price cycles.
How do corn prices influence ethanol profitability?
Corn prices set the cost floor, but profitability is determined by the net margin after factoring in co-product revenue. A $0.20 per bushel decrease in corn lowers cost by roughly $0.07 per gallon in a standard plant. For an integrated plant where DDGS, corn oil, and CO₂ offset 20-30% of feedstock cost, the effect is amplified: a lower corn price lowers gross cost, and co-product revenue remains stable, widening the margin by more than the commodity plant achieves.
Can ethanol plants remain profitable when oil prices are low?
Yes, but it depends on the cost structure. Plants that capture biogas for process heat and sell high-value co-products can sustain positive margins even when ethanol itself trades near production cost. In periods of $40 per barrel oil, plants I have observed with diversified revenue streams maintained cash flow because DDGS and corn oil markets do not track petroleum directly. Single-product plants, however, typically face shutdown pressure during those same conditions.
What is the forecast for fuel ethanol prices in 2026?
Global demand for biofuels is expected to remain firm, driven by expanding mandates in India, Brazil, and other markets. Corn prices may ease further if trend-line yields increase. However, policy shifts in the U.S. around RFS post-2025 create some uncertainty. The consensus among analysts is for ethanol prices to stay within a moderate range, but the spread between high-cost and low-cost producers will continue to separate outcomes significantly.
How can integrated plant design reduce exposure to price volatility?
Integrated design reduces exposure by lowering the effective feedstock cost per gallon and generating revenue streams that are not correlated with ethanol prices. When co-products cover 20-30% of total revenue, a price drop in ethanol does not translate to an equivalent drop in total plant income. Energy integration further buffers the plant by reducing variable costs regardless of commodity movements. For any project contemplating an ethanol plant, it is worth modeling how these diversification effects change the breakeven price and payback period under multiple market scenarios. Share your capacity and feedstock assumptions with our team at [email protected], and we will prepare a tailored break-even analysis.
If you’re interested, check out these related articles:
Driving Global Food Conservation Through Technological Innovation