

Corn ethanol yield per acre is not a single number; it is the product of field output, starch content, and biorefinery recovery. I have reviewed enough feasibility models to know that most yield claims mix a broad bushel average with an optimistic gallons-per-bushel assumption and treat the result as a bankable figure. The useful metric for an ethanol project is net fuel grade ethanol per planted acre after moisture, process loss, and co-product credits are reconciled. That number shows whether the project makes sense before capital is committed.
Field Baseline Data Sets The Corn Ethanol Yield Per Acre Range
A realistic yield per acre model starts with three independent variables: bushels per acre, starch per bushel, and recovered ethanol per unit of starch. Field data gives the first, grain quality gives the second, and plant mass balance gives the third. When a project proponent quotes only bushels per acre, they leave out the two factors that separate a strong ethanol return from a thin one. I have seen fields with high bushel counts underperform in ethanol output because the starch density and flour yield were below what the project budget assumed.
The baseline should be local, not national. Soil type, rainfall, hybrid maturity, and planting date all change the number of bushels and the fermentable starch inside each bushel. A project model that substitutes a regional average for measured local test data is not doing analysis; it is hiding uncertainty. We build yield baselines from on-farm samples, grain elevator records, and storage data so the field input matches the corn quality the plant will actually receive.
Agronomic Inputs Put A Ceiling On Corn Ethanol Yield Per Acre
Agronomic choices set the upper limit long before the plant receives the first truckload. Hybrid selection is the largest lever because starch content is a genetic trait as much as an environmental result. A hybrid bred for high grain yield may produce more bushels per acre but less starch per bushel, which means the ethanol yield per acre can move sideways or even fall when a project chases bushels alone. In yield audits, I compare starch content and test weight at the delivery point, not just the scale ticket.
Why Bushels Per Acre Can Rise While Starch Per Bushel Falls
The particle of interest for ethanol is the starch granule, not the whole kernel. When growing conditions favor large kernels or high oil content, the starch fraction in each bushel can drop even as total grain weight rises. For a dry mill, that tradeoff changes the fermentable solids sent to liquefaction. The plant still pays for the water, fiber, and protein in each kernel, but it cannot convert those fractions into ethanol. If a procurement plan does not correct for starch concentration, the plant line will underperform its nameplate capacity even when the grain silos are full.
Harvest Moisture And Drying Damage Change Plant Yield
Harvest moisture above the standard trade level forces drying before storage, and every drying pass risks starch damage, cracked kernels, and reduced enzyme access during liquefaction. High heat can gelatinize part of the starch in ways that change later saccharification efficiency. The field cannot recover that loss, and neither can the fermenter. In projects I have planned, we specify grain receiving and drying curves that match the ethanol plant’s enzyme system rather than treating drying as a separate storage function.
Starch Content And Test Weight Drive Biorefinery Output
Starch content is the primary input to the mass balance. The conversion chemistry is fixed: starch hydrolyzes to glucose, glucose ferments to ethanol and carbon dioxide, and the resulting broth is distilled and dehydrated to fuel grade ethanol. From the stoichiometry, one kilogram of starch yields about 0.568 kilograms of ethanol, but no commercial plant reaches theory because fiber, protein, and nonfermentable solids occupy reactor volume and because ethanol leaves the process in distillers grains, vent gas, and wastewater.
A better way to compare plant designs is recovered ethanol per dry ton of starch, not gallons per bushel of raw corn. Test weight matters because it correlates with kernel soundness, flour yield, and mill performance. Low test weight corn often contains more broken kernels and foreign material, which raises the pretreatment burden and reduces the clean starch load per ton. The plant does not get paid for the corn it bought; it gets paid for the ethanol it recovers.
| Plant parameter | What it influences | Where the yield effect appears |
|---|---|---|
| Starch content | Fermentable sugar load | Liquefaction and fermentation |
| Test weight | Mill yield and kernel soundness | Grinding and separation |
| Moisture | Drying energy and storage loss | Corn receiving and front end |
| Protein and oil | Nonfermentable solids | Stillage and distillers grains handling |
| Fermentation efficiency | Ethanol per unit sugar | Beer column and distillation |
If your feasibility model treats process conversion as a fixed number without testing the corn quality range your plant will actually receive, the error can be larger than the project margin. It is worth confirming the starch-to-ethanol factor against local grain samples before you lock the plant capacity. Send your regional corn data to [email protected] and we will run the yield reconciliation.
Dry Mill Conversion Efficiency Determines Gallons Per Bushel
Process conversion turns theoretical ethanol into saleable product. In a dry mill, corn is ground, slurried, cooked, liquefied, saccharified, fermented, and then passed through distillation and molecular sieve dehydration. Each step has an efficiency loss, and each loss compounds. The largest gap between theoretical and actual yield is usually in fermentation, but distillation and dehydration can also surrender ethanol if column controls are not set correctly.
Where Ethanol Loss Actually Happens In A Dry Mill
Losses are not evenly distributed. The earliest losses occur in grind and slurry: oversized particles do not release all their starch to enzymes. The next losses occur in fermentation when yeast activity drops from stress, contamination, or pH drift. The final losses occur when ethanol remains in the beer column bottoms and in the molecular sieve regeneration loop. I have seen plants report acceptable nameplate output while losing enough ethanol in stillage and vent gas to cover a full operator shift each month. A proper mass balance shows those leaks before they become routine.
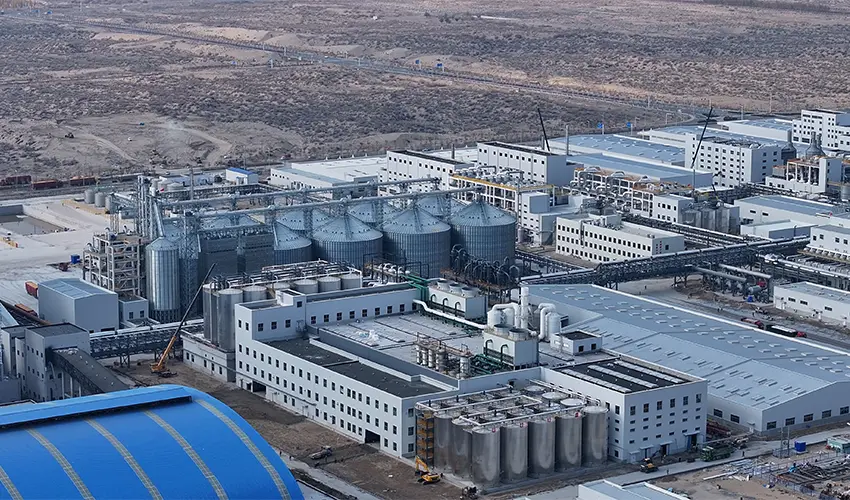
AGRIFAM’s alcohol process integration links fermentation, distillation, dehydration, biogas, and wastewater treatment into one utility system. The goal is not just to make ethanol but to keep steam, water, and carbon dioxide from eroding the net yield that the field already paid for. That integrated view matters more than the individual equipment list.
Co-Product Recovery Raises The Economic Yield Per Acre
Ethanol is not the only product leaving the plant. Every bushel of corn also yields distillers grains, carbon dioxide, and process energy or biogas. The economic corn ethanol yield per acre changes as soon as co-products enter the equation. A dry mill that only sells ethanol leaves real value in the stillage. When co-product revenue is credited back against corn cost, the effective cost per gallon drops, and that changes how much field yield a project needs to hit its return threshold.
In the circular model we use for corn ethanol planning, distillers grains become feed, fermentation carbon dioxide can be recovered for food grade or industrial use, and biogas from stillage treatment displaces purchased fuel. The full chain is corn, food, energy, and feed, not ethanol alone. That changes the economics because the plant can tolerate a lower ethanol yield per acre if the co-product stream is properly priced and contracted.
A yield per acre figure that comes from a crop report rather than a reconciled plant mass balance can misprice a project before design starts. AGRIFAM builds ethanol yield models from field data, starch conversion, utility use, and co-product recovery, and audits them against commissioned plants. Send your target ethanol volume, corn quality data, and regional grain economics to [email protected] or call 010-8591 2286 and we will run the numbers before you commit to land or process design.
Buyers Ask These Questions About Corn Ethanol Yield Per Acre
How many gallons of ethanol can one acre of corn produce?
The answer depends on starch delivery and plant recovery, not on a fixed national constant. A high starch corn field producing a strong bushel count will produce substantially more ethanol than the same bushel count at lower starch. I prefer to work the calculation in three parts: bushels per acre, starch per bushel, and recovered ethanol per unit of starch. Only when all three are local does the final gallons per acre figure mean anything for a project.
Why do published corn ethanol yield figures vary so much?
The variation is usually not a sign of bad measurement. It reflects different assumptions about field yield, starch content, plant conversion, and co-product allocation. A wet mill yield per acre is not directly comparable to a dry mill yield because the wet mill routes some starch to products other than ethanol. When someone quotes a single yield figure, look for the mass balance behind it before comparing two projects. The denominator matters as much as the numerator.
Does higher corn yield per acre always mean higher ethanol yield per acre?
It depends on whether starch concentration stays constant while bushels increase. If a higher yielding hybrid also produces lower starch per bushel, the ethanol yield per acre can stay flat or decline. The field produces more weight, but the plant receives less fermentable starch per ton. If starch content holds while bushels rise, then ethanol yield per acre rises almost in proportion. The decision rule is simple: buy on starch, not on bushels alone.
What process metric should I check before accepting a yield projection?
In projects I have reviewed, the first number I check is recovered ethanol per dry ton of starch, not gallons per bushel. That single ratio exposes whether the projection assumes unrealistic fermentation or distillation recovery. I then check the corn quality basis behind the starch figure and the co-product credits behind the cost model. If all three are aligned, the yield per acre projection can be audited. Share your regional corn data and target ethanol quality requirements and we will confirm whether the process assumptions hold.
If you’re interested, check out these related articles:
Driving Global Food Conservation Through Technological Innovation