
Most corn ethanol plants chasing higher yields focus narrowly on fermentation: yeast strains, enzyme dosing, temperature curves. That focus misses half the picture. Corn ethanol yield optimization depends as heavily on what happens before and after the fermenter — grain cleaning, milling uniformity, energy recovery, and co-product monetization — as on the biology inside it. In fifteen years of engineering complete alcohol production lines, AGRIFAM has found that plants which treat yield as a system-wide discipline rather than a department-level metric consistently outperform those that optimize single unit operations in isolation.
Grain Raw Material Determines Ethanol Yield
The starch inside the corn kernel is what gets converted to ethanol. If the incoming grain is inconsistent, no amount of fermentation fine-tuning will deliver steady output. Corn moisture, test weight, starch content, and the percentage of broken or foreign material all set a ceiling on the theoretical yield long before the grain reaches the hammer mill.
One parameter many plants overlook is kernel integrity. Corn with high percentages of cracked or broken kernels loses starch during cleaning and transport. Mycotoxin development in damaged grain can further suppress yeast activity later. AGRIFAM’s grain storage and handling systems, designed for low breakage conveying and residue-free operation, maintain kernel quality from silo to process intake. The payoff shows up directly in downstream efficiency.
| Corn Quality Parameter | Practical Range | Effect on Ethanol Yield |
|---|---|---|
| Starch Content (dry basis) | 70–74% | Each percentage point gain adds roughly 2–3% more fermentable substrate |
| Moisture at Intake | 14–16% | Too low reduces enzyme penetration; too high increases spoilage risk |
| Broken Kernel Fraction | Under 5% | Broken kernels generate starch loss and dust hazards |
| Foreign Material | Under 3% | Non-fermentable mass increases handling cost and equipment wear |
How does corn moisture content affect ethanol yield?
Moisture above 16% accelerates mold growth and can produce mycotoxins that stress yeast, reducing fermentation efficiency and final yield. When corn is too dry (below 13%), the endosperm becomes brittle, creating excess fines during milling that complicate downstream separation and lower starch recovery. Maintaining grain at 14–15% moisture inside climate-controlled storage preserves both the starch and the kernel structure the mill was designed for.
What is the ideal starch content to target?
Seventy-two percent starch is the commercial benchmark, but regional corn varies by several points. Beyond simply sourcing higher-starch lots, the more practical move is consistent blend planning: taking delivery streams with known starch values and blending them to a narrow target range before milling. A steady starch input removes a variable the fermenter would otherwise have to absorb.
Milling and Purification Unlock Starch Conversion
A mill that produces a wide particle size distribution will never release starch uniformly. Fine particles gelatinize too early and risk viscosity problems in the liquefaction tank; coarse particles leave starch trapped inside the endosperm, passing through the process unreacted. Both outcomes reduce the amount of fermentable sugar available for yeast.
The difference between a plant that gets 90% starch recovery and one that gets 95% translates into millions of liters of lost ethanol over a year. AGRIFAM’s corn starch processing systems, which apply a closed-loop water circuit and multi-stage purification, routinely push recovery above 94% in commercial operation. The same principles translate directly to dry-grind ethanol: precise particle control, effective removal of foreign material, and uniform slurry preparation set the stage for everything that follows.
A common mistake is treating milling as a fixed step rather than a tunable variable. Screen size, hammer tip speed, and moisture conditioning can all be adjusted based on incoming corn characteristics. When we commission a new alcohol line, the milling setup is among the first parameters we dial in during the performance test run, because the rest of the process has no way to compensate for what is lost here.
Liquefaction and Saccharification Precision Maximizes Sugar Yield
Getting starch into solution is only half the battle. The enzymatic liquefaction step must reduce slurry viscosity fast enough to avoid heat transfer bottlenecks, while the saccharification step must convert the resulting dextrins into fermentable sugars — glucose, maltose, and maltotriose — that yeast can metabolize efficiently.
Thermostable alpha-amylase selection and dosage depend heavily on the dry solids content of the slurry and the temperature profile of the jet cooker. Under-dosing leaves ungelatinized starch; over-dosing adds cost without proportional benefit. In saccharification, glucoamylase pullulanase blends have become the standard because they cleave both alpha-1,4 and alpha-1,6 linkages, producing a higher glucose yield from the same dextrin pool. But the real lever is residence time and pH control: a plant that maintains tight pH and temperature setpoints in the saccharification tank will routinely extract 3–5% more fermentable sugar from the same corn than one with loose control.
Which enzymes produce the highest fermentable sugar yield?
A combined glucoamylase-pullulanase formulation consistently delivers higher glucose equivalents than glucoamylase alone because it breaks the branch points in amylopectin that otherwise leave residual limit dextrins. Pairing this with a thermostable alpha-amylase that retains activity through the jet cooking step ensures that starch gelatinization is complete before saccharification begins, maximizing available substrate for the downstream enzymes.
Fermentation Optimization Requires Yeast Health and Continuity
Once fermentable sugar is available, the question shifts to how completely and how quickly yeast converts it to ethanol. Modern fuel ethanol plants have largely moved to continuous or cascade fermentation systems because they sustain higher cell density and reduce downtime for cleaning. In a well-managed continuous fermenter, ethanol titers of 14–16% (v/v) are achievable with fermentation efficiencies above 92%.
The three stress factors that suppress yeast performance are ethanol toxicity, temperature excursions, and bacterial contamination. Ethanol inhibition starts to slow fermentation above 10% (v/v), so managing the dilution rate to maintain a target ethanol concentration in each cascade stage is more important than pushing a single tank to its limit. Temperature spikes above 34°C accelerate inhibition and increase by-product glycerol formation, stealing carbon that should go to ethanol. Lactic acid bacteria can consume 1–2% of the sugar stream if not controlled, so a robust CIP protocol and antibiotic rotation strategy are non-negotiable.
In the continuous systems we have engineered, yeast recycle loops equipped with heat exchangers keep the fermenter within a 32-33°C band even in tropical climates. The difference between a plant that averages 90% fermentation efficiency and one that holds 93% can represent 10,000 tons of additional ethanol per year at a 300,000-ton corn throughput scale.
Energy Cascade and Byproduct Revenue Multiply Effective Yield
Yield optimization does not stop at the distillation column. An ethanol plant that vents its waste heat and discards its process residues is leaving 20–30% of its value unrealized. The economic yield — the profit per ton of corn — depends on how thoroughly the plant uses the energy and material streams it already produces.
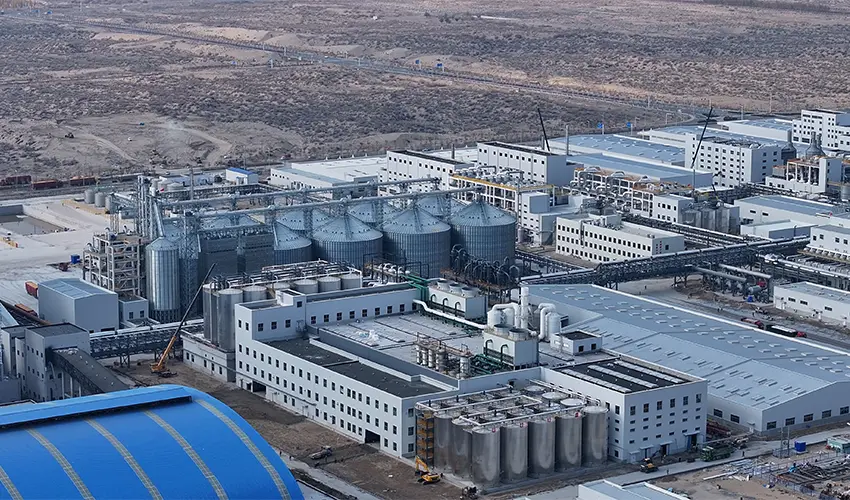
AGRIFAM’s alcohol production solution applies energy cascade utilization: high-grade steam drives the distillation and molecular sieve dehydration units, the resulting low-pressure vapor preheats the incoming slurry, and waste hot water from the rectification column serves the liquefaction step. This cascading approach cuts total plant steam consumption by up to 25% compared with non-integrated designs.
On the co-product side, DDGS quality directly affects revenue. Controlling the drying temperature to avoid protein damage while achieving shelf-stable moisture (under 12%) yields a protein-rich feed ingredient that commands a premium in livestock markets. Capturing CO2 from the fermenter and purifying it to food-grade liquid CO2 adds a revenue stream that, in a plant producing 200,000 tons of ethanol annually, can exceed several million dollars per year. Biogas from anaerobic treatment of thin stillage further offsets natural gas consumption, tightening the energy loop.
These flows are not optional add-ons. They are integral to how we design every new alcohol production line — because when the plant monetizes its waste streams, the effective yield per bushel of corn rises even if the ethanol gallons stay the same.
If your plant’s energy and co-product systems are not currently integrated into the process control architecture, the yield gap may be larger than the fermenter data suggests. Our engineering team can evaluate your current energy balance and identify practical integration points — reach out at [email protected].
Intelligent Plant Management Delivers Consistent Yield Outcomes
Real yield gains require operating setpoints that hold steady across shift changes, seasonal feedstock variation, and equipment wear. DCS and SCADA platforms now make it possible to monitor every unit operation in real time: corn moisture at intake, mill motor load, liquefaction viscosity, fermenter CO2 off-gas rate, distillation column pressure profile, and DDGS dryer exhaust temperature.
When these data streams feed into a unified control platform, the plant stops reacting to yield losses after they occur and starts preventing them. A drop in CO2 off-gas signals a fermentation slowdown hours before ethanol titer measurement confirms it. Rising column differential pressure alerts the operator to fouling before flood conditions develop. AGRIFAM integrates these systems from the initial process design phase so that operator training, control logic, and maintenance scheduling align from day one. The result is a plant that runs closer to its nameplate yield every operating day, not just during quarterly optimization campaigns.
This is where the strategic payoff of a turnkey EPC partner becomes visible. When the same engineering team designs the process, selects the equipment, programs the automation, and commissions the plant, there is no gap between the intended operating envelope and what the control system can actually deliver.
Common Questions About Corn Ethanol Yield Optimization
What is a realistic ethanol yield per ton of corn?
Most well-operated dry-grind plants achieve 400–420 liters of anhydrous ethanol per metric ton of No. 2 yellow corn at 15% moisture. Achieving 430 liters per ton requires a combination of high-starch corn, optimized milling, and fermentation efficiency above 93%. The last 10 liters are the most expensive to capture and demand system-wide integration rather than incremental enzyme adjustments.
Why do two plants using the same corn get different yields?
Corn is only one input. Differences in mill grind consistency, liquefaction residence time, fermentation temperature stability, and distillation column efficiency can create a 15–25 liter per ton spread between plants. The single largest factor is usually energy integration: a plant that recycles waste heat maintains lower operating costs and avoids process disruptions that cause yield excursions.
Does continuous fermentation always outperform batch?
Continuous fermentation typically delivers higher volumetric productivity and more consistent ethanol titers because yeast stays in an exponential growth phase and process disturbances are diluted across the cascade. It is not automatically better if the plant lacks robust CIP and contamination control. A batch plant with rigorous hygiene can outperform a poorly managed continuous system, so the operating discipline matters as much as the configuration.
How do I know if my plant’s yield problem starts before the fermenter?
Pull a composite corn sample before milling and test for starch, moisture, and broken kernel percentage. Then measure the starch recovery across the mill and the glucose yield after saccharification. If glucose available to fermenter is less than 95% of theoretical from the corn starch input, the bottleneck is upstream. Our process audits often find that yield losses attributed to yeast are actually created in the grain cleaning and milling stages.
How do I justify the capital cost of an integrated yield improvement project?
We model the payback based on three levers: increased ethanol volume from the same corn input, reduced energy cost per liter, and additional revenue from improved co-product quality (DDGS protein, CO2 capture). In a typical 200,000-ton corn throughput plant, a 3% yield improvement combined with 20% energy reduction and CO2 monetization delivers a full capital payback within 24–36 months. Send your current production data and we will run a site-specific economic model — contact AGRIFAM at [email protected] or call 010-8591 2286.
If you’re interested, check out these related articles:
Driving Global Food Conservation Through Technological Innovation