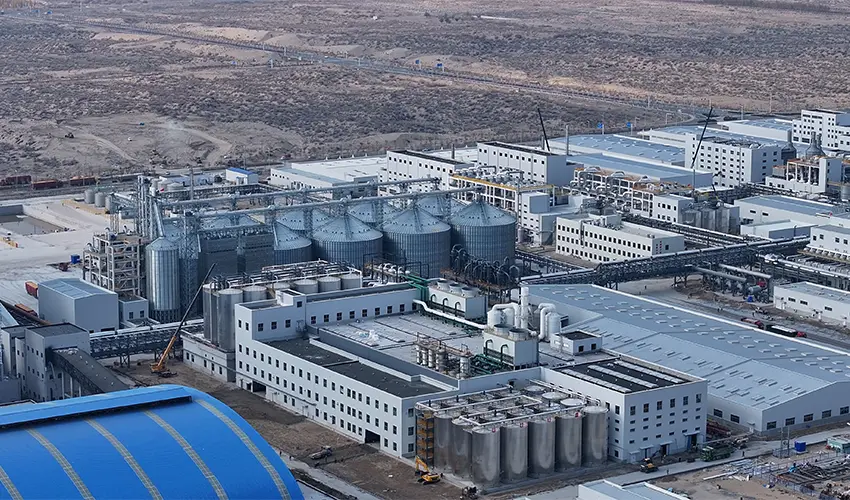

The financial case for a corn ethanol plant is rarely made or broken by ethanol spot prices alone. In nearly two decades of agricultural infrastructure planning, I have observed that the most consequential factor in payback modeling is not the sell price of ethanol but the effective monetization of what many investors treat as waste. DDGS, CO2, and biogas—the by-product streams that fully integrated plants capture—can cut the payback period by years. This analysis examines how to build a model that reflects the true income potential of a modern corn ethanol project, from capital outlay through energy integration to co-product revenue.
Corn Ethanol Project Capital Cost: What to Expect
A fuel ethanol plant’s upfront investment is driven by process configuration, site conditions, and the scope of by-product handling. The core equipment package—milling, liquefaction, fermentation, distillation, molecular sieve dehydration—typically accounts for 55–65% of the total fixed capital, with off-site utilities, storage, and water treatment adding another 20–25%. Engineering, procurement, and construction management (EPCM) fees, freight, and contingency round out the balance. Choosing a design that includes anaerobic digestion for stillage and a CO2 recovery unit adds capital but builds the revenue infrastructure that substantially shortens the payback window.
Operating Cost Drivers and Their ROI Impact
The single largest operating expense is corn feedstock, which can represent 65–75% of total production cost depending on local grain logistics and seasonal spreads. Natural gas for steam generation is the next dominant line item, followed by enzymes, yeast, chemicals, and labor. Electricity for milling and cooling is smaller but not negligible. Because corn and energy are commodity markets, a plant’s ability to maintain margin depends heavily on fixed-price supply agreements and on internal energy recovery measures that cushion the facility from price spikes. When net corn cost is adjusted for DDGS revenue (which reduces effective feedstock cost by roughly 20–30%), the operating economics shift from break-even to profitable territory even in moderate ethanol price environments.
Revenue Beyond Fuel Ethanol: DDGS, CO2, and Biogas
The by-product streams in a corn ethanol plant are not side income; they are structurally integral to project ROI. DDGS (distillers dried grains with solubles), produced at roughly 17–18 kg per bushel of corn, commands a protein-rich feed market that can offset a significant share of the corn bill. Food-grade liquid CO2, recovered from fermentation off-gas and purified, supplies the beverage and dry-ice industries with a high-value product that often enjoys stable regional pricing. Meanwhile, biogas from anaerobic digestion of thin stillage and wastewater provides boiler fuel, displacing natural gas consumption. A plant designed with full by-product capture regularly earns 25–35% of its revenue from these streams, transforming a 5-year payback into a 3-year proposition.
| By-Product | Typical Annual Output (100 MLY plant) | Revenue Contribution | Key Market |
|---|---|---|---|
| DDGS | 180,000–200,000 tonnes | 60–70% of by-product revenue | Livestock feed |
| Liquid CO2 (food grade) | 10,000–15,000 tonnes | 20–25% | Beverage, industrial |
| Biogas (as fuel) | 15–20 million Nm³ | 10–15% | On-site boiler fuel |
If your project involves variable by-product off-take agreements, it is worth confirming revenue assumptions with an engineering team that has integrated the full co-product value chain—reach out at [email protected].
Energy Cascade Utilization and Its Effect on Payback Period
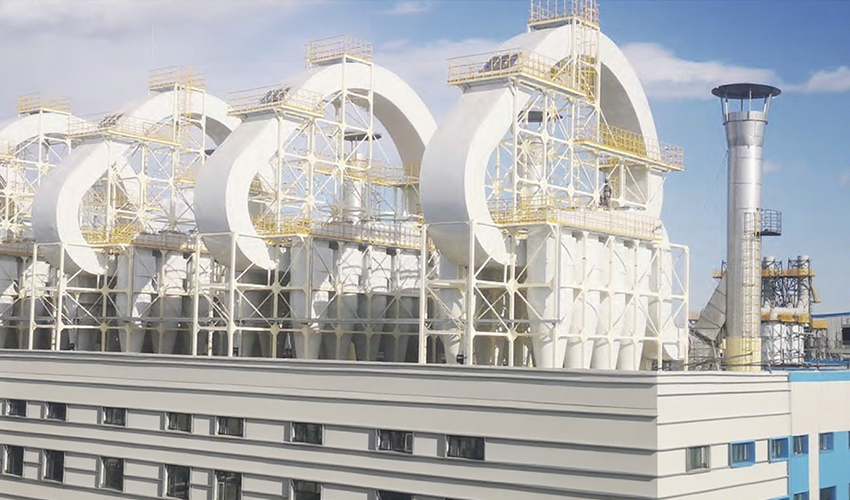
Energy consumption is the second-largest operating cost and the most controllable through integrated design. In projects we have supported, applying energy cascade principles—where steam is used in a pressure-declining sequence from distillation to evaporation and then to stillage drying—cuts overall thermal energy use by approximately 25% compared to conventional plants. This is not a theoretical figure; it is achieved by matching steam quality to each unit operation’s temperature requirement and by deploying mechanical vapor recompression (MVR) on evaporators. Waste heat recovery from the distillation overheads, combined with biogas co-firing, can push the plant’s net energy balance close to self-sufficiency during steady-state operation. Every percentage point of energy saved drops directly to the bottom line and compresses the payback period.
How Does Waste Heat Recovery Lower Plant Energy Costs?
Distillation columns, mash cookers, and dryer exhaust release large quantities of low-grade heat that, when recovered via heat exchangers, preheat incoming feedstock or generate hot water for CIP systems. This recovered thermal energy reduces the steam load on the boiler, directly cutting natural gas consumption. In a well-integrated plant, waste heat recovery can lower thermal energy use by 15–20%, enough to shave 0.8–1.2 cents per liter from production cost.
What Is Energy Cascade Utilization in an Ethanol Plant?
Energy cascade refers to the sequential use of the same steam energy across multiple unit operations at declining pressure levels. High-pressure steam drives the distillation reboiler, medium-pressure exhaust heats the evaporation system, and low-pressure condensate flash steam preheats process water. This approach avoids the common inefficiency of generating fresh steam for each heating step and is a hallmark of integrated plant design.
Sensitivity Analysis: Modeling Feedstock and Price Volatility
The most honest financial model is one that tests assumptions when they break. Corn price is the dominant volatility driver. A sensitivity analysis that uses a corn price range of $4.50 to $7.00 per bushel and ethanol plant-gate price from $1.60 to $2.20 per gallon, with DDGS held at $180–250 per ton and natural gas at $3.50–6.00 per MMBtu, reveals that by-product revenue acts as a powerful buffer. In our modeling, even at the high end of the corn price range, a plant capturing full CO2 and biogas revenue maintains a positive EBITDA. The break-even point shifts from an ethanol price of $1.90 per gallon (no by-product) to $1.45 per gallon (full by-product capture). This demonstrates that the “price to beat” is not ethanol but the net margin after co-products.
Which Variables Most Affect Ethanol Plant Profitability?
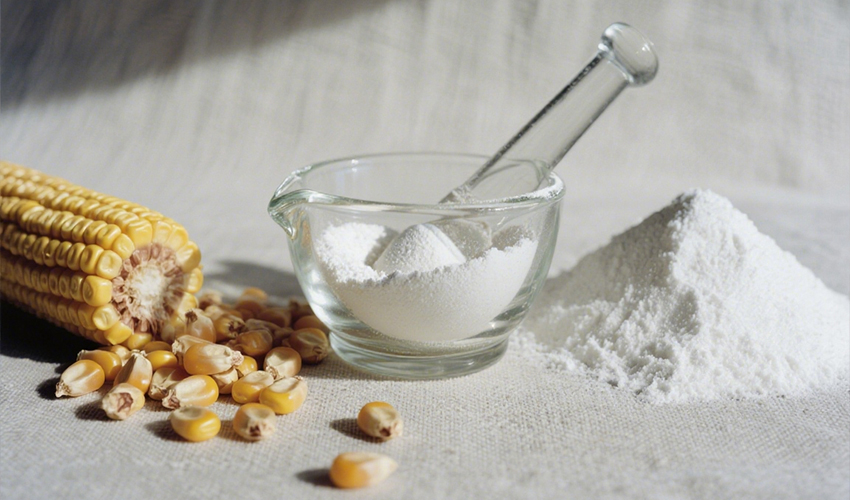
The hierarchy is clear: corn cost, DDGS price, natural gas, and ethanol price—in that order. A 10% increase in corn price reduces IRR by roughly 4 percentage points, while a 10% rise in DDGS price improves IRR by about 2.5 points. Natural gas has a secondary but meaningful impact. Ethanol price, while the revenue headline, is fourth in sensitivity because by-product revenue composes a large enough share to stabilize total income.
Selecting an Engineer for Integrated Ethanol Project Delivery
Achieving the ROI figures discussed above depends on execution. The difference between a plant that meets financial projections and one that falls short often comes down to whether the EPC partner understands integrated system design, not just equipment supply. An engineering team with experience in energy cascade, biogas integration, and high-purity CO2 recovery brings more than technical capability—it brings the process knowledge to identify where capital can be reallocated for higher marginal revenue. When ready to move from financial model to project execution, our team can review your assumptions and provide integrated system design proposals. Speak with our engineers at 010-8591 2286 or [email protected].
Common Questions About Corn Ethanol Project ROI
For a greenfield 100–150 million liter per year plant, the payback window lands between 3.5 and 5 years when the design incorporates full DDGS drying, food-grade CO₂ recovery, and biogas-to-boiler systems. If the plant relies solely on fuel ethanol sales, the same facility would need 6 to 8 years to recover its capital, assuming $5.00 corn and $2.00 ethanol del plant. The difference is not marginal—it reflects roughly $40 million in additional cash flow over a six-year operating horizon.
It can, but only with strong by-product income. At $1.60 per gallon ethanol, a fully integrated plant with DDGS revenue of $220/ton, CO₂ revenue of $120/ton, and biogas offsetting 30% of natural gas can still generate a 12–14% IRR. Strip out CO₂ and biogas, and the return collapses to single digits or negative. The key is that the revenue floor is set by co-products, not ethanol.
Location matters as much as process design. Basis to corn—the difference between the local cash price and the Chicago Board of Trade—can swing feedstock cost by 10–15%. Proximity to cattle or poultry feedlots raises DDGS netbacks, while being within 150 kilometers of a beverage bottler or dry-ice plant secures CO₂ offtake at higher prices. In our planning, we treat site selection as a financial variable, not just a logistics one.
Yes, but the economics depend on the plant’s current layout and off-take agreements. Adding a CO₂ liquefaction and purification train typically pays for itself in 18–24 months if food-grade markets are accessible. Installing a covered anaerobic lagoon or CSTR digester for biogas can slash natural gas bills within the first operating season. A thorough audit of your current process mass balance is the essential starting point. If your feasibility model depends on reliable output from an integrated co-product system, our team can deliver detailed engineering data and process guarantees to support your assumptions—reach out at [email protected].
If you’re interested, check out these related articles:
Driving Global Food Conservation Through Technological Innovation