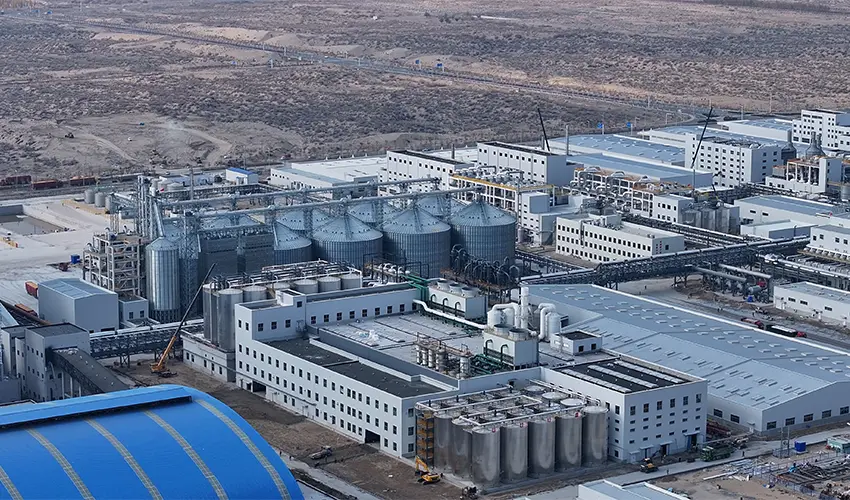

Corn ethanol energy balance is not a single number. It is a system result that changes with the boundary a study draws, the coproducts it credits, and the way an individual plant manages steam, electricity, and stillage. In our work we treat the balance as an engineering question first: does the facility return enough renewable energy to justify the fossil inputs required to build, operate, and supply it? The answer in a modern dry mill is usually yes, but only when the plant captures waste heat, uses biogas, and sells or feeds the coproducts rather than writing them off.
Corn Ethanol Energy Balance Starts With System Boundaries
An energy balance compares the energy delivered in ethanol and useful coproducts against the fossil energy consumed across a defined system. The boundary matters more than the final ratio because it determines what counts as an input. A biorefinery-gate analysis includes natural gas, purchased electricity, enzymes, and chemicals. A field-to-wheel analysis adds corn farming, fertilizer, transport, and fuel distribution. The second boundary produces a more conservative number, but it answers a different question: how much fossil fuel the full corn ethanol chain displaces rather than how efficiently one plant converts starch to alcohol.
Fossil fuel displacement sits on the output side of that balance. Ethanol replaces gasoline. Distillers grains replace corn and soybean meal in livestock rations. Captured carbon dioxide can replace industrial CO2. Biogas from thin stillage or wastewater can replace purchased natural gas. If a study ignores those coproduct streams, the energy balance will understate the plant because the facility is being treated as a single-product refinery when it is actually a multi-output processing site.
In our alcohol EPC work, I have walked through plants where a poorly matched distillation heat recovery system forced the boiler to carry load that should have come from process steam, so I now start with the boundary the client must defend and keep that boundary constant across options.
The Net Energy Ratio Depends on Allocation and Coproduct Credits
The net energy ratio moves sharply with the method used to allocate energy inputs between ethanol and coproducts. Process energy allocation assigns all inputs to the primary product and leaves DDGS, corn oil, and captured CO2 with no energy burden. That produces one result. Energy allocation and market value allocation spread the input burden across products and produce different results. Displacement credits go further by estimating how much gasoline, corn, soybean meal, or industrial CO2 the outputs replace.
| Method | What it credits | What the result tells you |
|---|---|---|
| Process energy only | Ethanol output | Biorefinery conversion efficiency |
| Energy allocation | Shares inputs by energy content | Energy burden carried by each product |
| Market value allocation | Shares inputs by sales value | Economic energy burden |
| Displacement | Replaced gasoline, corn, soybean meal, CO2 | System level fossil displacement |
Because these methods answer different questions, a project should not compare numbers across definitions. A facility that looks weak under process energy allocation can look strong under displacement credit without any change in actual steam or electricity use. The engineering fix is to report the boundary and allocation method next to the ratio and to test sensitivity rather than defend a single figure.
Why the Same Plant Can Post Different Net Energy Ratios
The same dry mill can produce published ratios that differ substantially depending on whether corn farming is inside the boundary and whether coproducts carry an input burden. That does not mean the plant changed. It means the analyst changed the question. For a capital decision, we run both a plant-gate ratio to test the equipment and a full-chain ratio to test the feedstock and fuel displacement logic, then show where the gap comes from.
Fossil Fuel Displacement Comes From More Than Ethanol
A dry mill takes in corn, natural gas, electricity, water, enzymes, and yeast. It sends out ethanol, distillers grains, corn oil, and carbon dioxide. The fossil fuel replacement value of the outputs is what makes the system interesting. Ethanol displaces gasoline used in transport. Distillers grains displace corn and soybean meal that would otherwise be produced and shipped to feed yards. Corn oil can replace other feed or fuel oils. Captured CO2 replaces merchant CO2, and biogas from anaerobic digestion replaces natural gas in the plant boiler or dryer.

The largest fossil displacement usually comes from ethanol, but the coproducts are not marginal. In a plant that dries all distillers grains, the dryer consumes substantial natural gas. If the same plant sends wet distillers grains to nearby cattle operations and captures biogas from stillage, the energy balance changes because two different streams move in opposite directions. One adds gas demand and the other subtracts it. A plant energy audit should list every coproduct outlet alongside its energy consequence, because a change in the feed market can alter the balance more than a change in distillation technology.
Modern Dry Mills Carry Specific Energy Loads and Failure Modes
The main energy consumers in a corn ethanol plant are distillation, evaporation, and DDGS drying. Distillation is the largest steam user. Evaporation concentrates thin stillage, and the dryer turns wet distillers grains into a storable feed product. Grid electricity runs grinding, pumping, agitation, and cooling. A plant that does not recover waste heat from distillation and evaporation will burn far more natural gas than a plant that cascades those heat loads.
Failure modes show up in the same places. A dryer operated without moisture control can overdry product and waste gas. A heat exchanger that fouls from thin stillage loses transfer efficiency and forces the boiler to work harder. A biogas system that receives variable stillage flow may flare gas instead of burning it, so the plant loses a fossil fuel offset it was counting on. These are not paper losses; they appear directly in the monthly natural gas bill and in the net energy ratio.
Why Plant Age Distorts the Comparison
Older dry mills built before modern heat integration are not a clean comparison for a new plant. They often lack multi-effect evaporation, mechanical vapor recompression, or biogas recovery, so their balance reflects the vintage of the design rather than the potential of the process. When a developer compares a proposed facility against an old plant, we separate the process from the site and re-evaluate the same heat and mass balance with current integration options.
If your program includes corn drying, stillage evaporation, or biogas recovery, the balance will be set before the main equipment is specified. Send your feedstock quality, target capacity, and local energy price to [email protected] and we will confirm the steam and power balance before you finalize the process configuration.
Integrated Plant Design Changes the Energy Balance
An ethanol plant is not a fixed object. The same corn input can end up in a high-carbon facility or a low-carbon facility depending on how the engineering connects the unit operations. AGRIFAM’s alcohol EPC solutions are built around energy cascade utilization, biogas recovery, and wastewater treatment as part of the main process rather than as add-ons. The corn processing route carries a 25% energy consumption reduction target through equipment selection, heat integration, and control design.
That integration matters for the balance. Waste heat from distillation preheats incoming streams. Biogas from stillage offsets boiler gas. Recovered water reduces pumping and treatment loads. When those systems are designed together, the plant does not simply produce ethanol; it converts a larger share of the corn kernel into useful energy and feed products, which is the point of a credible energy balance.
Energy balance problems are easier to correct during process configuration than after commissioning. If your corn supply varies in moisture, your site has limited water or gas, or you need to justify the project to lenders, we would rather run the heat and mass balance early. Send your plant capacity, corn moisture range, and target ethanol specification to [email protected] or call 010-8591 2286, and we will map the energy cascade and coproduct recovery options for your site.
Corn Ethanol Energy Balance Questions Start With Boundaries and Coproducts
Why do corn ethanol energy balance estimates vary so much?
Estimates vary because analysts choose different boundaries and allocation methods. A plant-gate ratio that excludes corn farming and credits only ethanol will differ from a field-to-wheel ratio that includes fertilizer and credits DDGS, corn oil, CO2, and biogas. The process is the same; the accounting is not. Before relying on a published number, check the boundary, the coproduct credits, and the vintage of the plants in the dataset.
Does DDGS credit make the energy balance look better than it is?
The common concern is that DDGS credit inflates the ratio. In a displacement framework, the credit reflects real replacement value: DDGS replaces corn and soybean meal that would otherwise consume energy to grow, process, and ship. The credit can be too generous if the local feed market cannot absorb that volume at the assumed value, which is why a site-specific feed study matters.
Does ethanol replace more fossil fuel than it consumes?
It depends on the system. At the biorefinery gate, a modern dry mill with heat integration and biogas recovery can return more energy in ethanol and coproducts than it consumes as fossil fuel. In a full field-to-wheel model, the margin is narrower because corn farming and transport add fossil inputs. The displacement question is not answered by one ratio; it requires comparing the ethanol chain against the gasoline chain it replaces.
How should a project developer choose an energy boundary for a corn ethanol plant?
In our project work we run both boundaries. The plant-gate boundary shows whether the equipment is efficient enough to build; the full-chain boundary shows whether the project can stand up to policy and lender review. We also test the coproduct strategy separately because DDGS, corn oil, and biogas value depends on the local market. If the two boundaries point in opposite directions, the solution is usually in the heat and mass balance, not in the ethanol yield alone. Send your capacity, corn moisture range, and local utility rates to [email protected] and we will confirm which boundary and coproduct strategy fit the project.
If you’re interested, check out these related articles:
Driving Global Food Conservation Through Technological Innovation