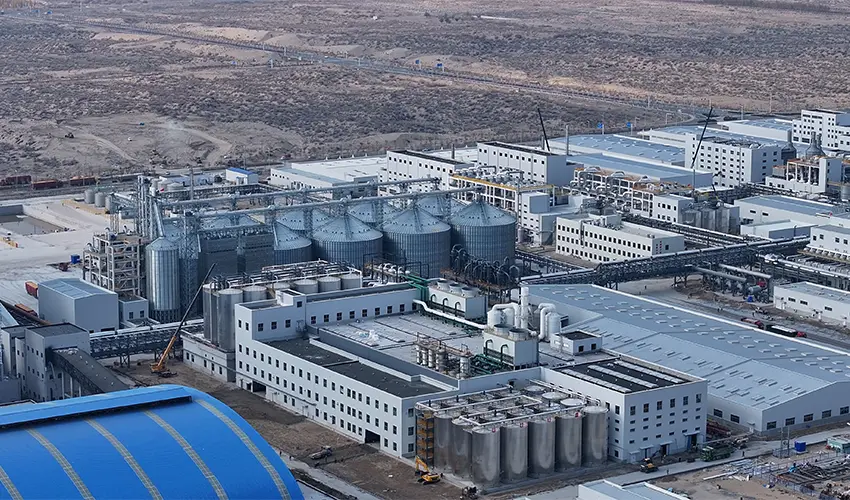

Ethanol margins are under pressure. Corn prices stay volatile, fuel demand growth is uneven, and carbon intensity requirements keep tightening. The ethanol industry trends 2026 are pointing toward a structural shift: standalone distilleries that produce only fuel ethanol will struggle to compete against integrated biorefineries that extract value from every co‑product stream. After working on grain processing and alcohol projects across multiple geographies, I have seen how plants that design for circularity from day one — recovering CO2, converting stillage into high‑quality DDGS, and generating biogas from wastewater — can transform their economics even when fuel ethanol prices dip. This is the year that co‑product revenue and energy integration become the baseline expectation, not a premium option.
Market Drivers Reshaping Ethanol Demand in 2026
Global ethanol consumption remains on an upward trajectory, but the growth pattern is fragmenting. The United States still dominates production, driven by E15 year‑round approval and RFS blending targets. Brazil maintains steady demand through its flex‑fuel fleet and RenovaBio carbon credit program. The acceleration, however, is in Asia and Africa, where countries are accelerating biofuel blending mandates to cut oil import bills and meet climate pledges.
India is rolling out its E20 mandate ahead of schedule, creating a pull that reshapes regional trade flows. The EU is coupling Renewable Energy Directive III targets with emerging sustainable aviation fuel mandates, moving ethanol demand into jet fuel pathways. Southeast Asian nations are announcing ethanol‑blending timelines that will add significant demand by 2027. These policy‑driven markets reward low‑carbon ethanol, giving an edge to plants that can document a low CI score.
| Region | 2026 Demand Driver | Trend |
|---|---|---|
| United States | E15 expansion, RFS progress | Moderate growth |
| Brazil | Flex‑fuel fleet, RenovaBio | Steady |
| India | E20 mandate acceleration | Rapid growth |
| European Union | RED III and SAF mandates | Strong policy pull |
| Southeast Asia | New blending targets | Emerging demand |
How Policy and Carbon Standards Rewrite Ethanol Economics
Carbon intensity scores are no longer a regulatory footnote. They determine access to premium markets. California LCFS credits can add $0.20 to $0.40 per gallon to ethanol sold into the state, but only for producers who can verify a low CI pathway. At the federal level, the IRS Section 45Z clean fuel production credit, effective in 2025, ties the tax incentive directly to the carbon intensity of the fuel — making CI the unit of currency for ethanol profitability.
Across the Atlantic, the EU RED III framework imposes a 14% greenhouse gas saving threshold compared to the fossil fuel comparator, and individual member states are layering on additional requirements. Brazil’s RenovaBio links biofuel certification directly to CI performance, creating a market where efficient plants earn sellable decarbonization credits. The thread running through all these programs is that the plant’s design choices — feedstock sourcing, process energy, co‑product handling — directly determine its CI score and its margin.
| Policy Program | Key Carbon Metric | Impact on Ethanol Value |
|---|---|---|
| California LCFS | CI score vs. gasoline baseline | Premium of $0.20‑0.40/gal |
| US 45Z credit | CI‑based tax credit | Fixed per‑gallon credit |
| EU RED III | 14% GHG saving minimum | Market access threshold |
| Brazil RenovaBio | Energy‑environmental efficiency | Tradeable CBIOs |
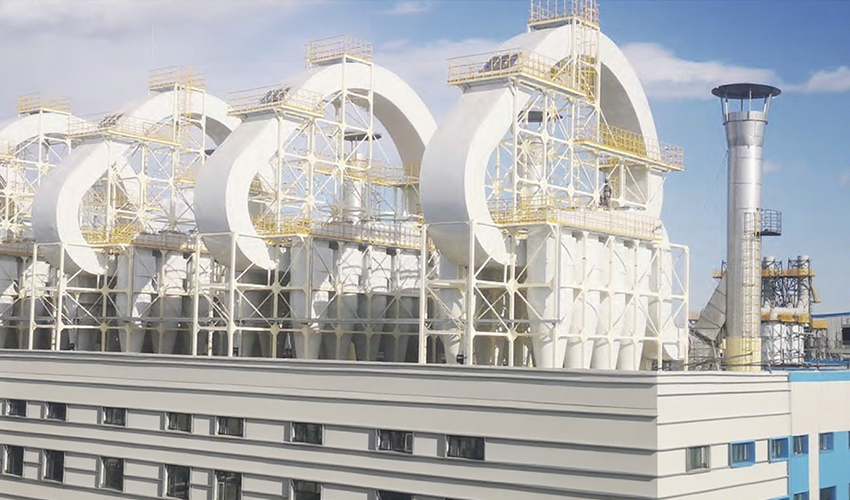
Technology Gains Driving Higher Corn‑to‑Ethanol Efficiency
Process technology has moved well beyond the batch fermentation and two‑column distillation that defined first‑generation plants. Continuous fermentation with yeast recycling now achieves conversion efficiencies above 92%. Simultaneous saccharification and fermentation, supported by tailored enzyme cocktails, is squeezing more fermentable sugars from each bushel of corn. Molecular sieve dehydration units, using pressure swing adsorption, deliver 99.8% anhydrous ethanol with a fraction of the energy that azeotropic distillation once consumed.
The bigger shift is in plant‑wide digital control. A central DCS that integrates milling, liquefaction, fermentation, distillation, dehydration, and the co‑product stream allows operators to respond to corn quality variation and energy pricing in real time. In the plants we engineer, intelligent digital control is not a separate add‑on; it is part of the process design from the start, and it consistently reduces total site energy consumption. One of our integrated alcohol facilities recorded a 25% energy consumption reduction compared to a conventional plant of the same capacity, solely through energy cascade design and automated process optimization.
For projects where energy integration and co‑product recovery are being considered, the design decisions made at the P&ID stage will lock in the plant’s efficiency ceiling for decades. If your program involves evaluating a new ethanol facility or expanding an existing one, reviewing the process integration options with an engineering team that has delivered fully integrated plants — not just the ethanol unit — can save capital and operating costs. Reach out at [email protected] to discuss your specific parameters before finalizing the scope of supply.
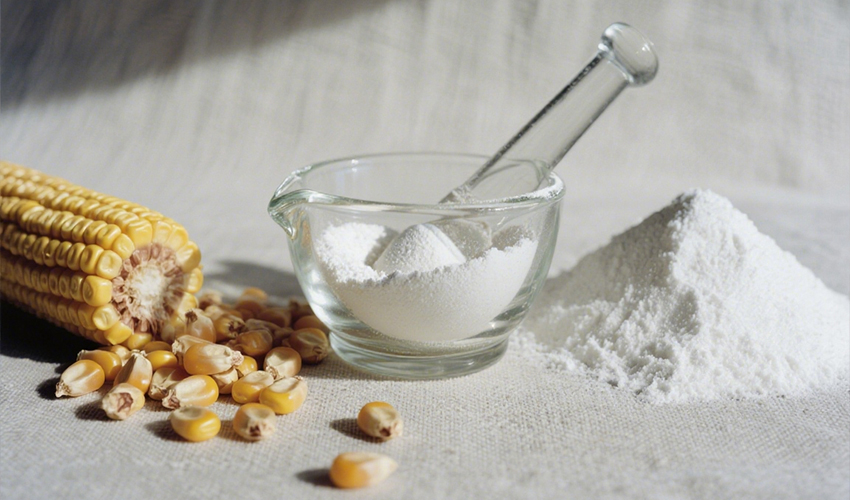
Why Co‑Product Revenue Turns Ethanol Plants into Biorefineries
Fuel ethanol alone rarely carries the plant. In a typical corn dry‑mill plant, ethanol contributes 70 to 80% of revenue; the remaining 20 to 30% comes from distillers grains, corn oil, and captured CO2. When those co‑product streams are designed as integrated revenue lines rather than afterthoughts, the plant’s breakeven corn price can shift by several dollars per bushel.
Distillers grains (DDGS) remain the largest co‑product revenue stream, and quality matters. Protein content, digestibility, and mycotoxin control determine whether the DDGS goes into domestic cattle feed at commodity prices or into premium export markets. Corn oil, separated from thin stillage, sells into biodiesel and poultry feed. CO2 capture, once dismissed as too capital‑intensive, is now economically viable at plants above 50 million gallons per year — particularly when local food‑grade or industrial CO2 demand exists, and especially in markets where carbon utilization credits are available.
Biogas from anaerobic digestion of thin stillage or wastewater rounds out the portfolio. A well‑designed biogas system can offset 10 to 15% of the plant’s natural gas demand, directly reducing both operating cost and CI score. The result is a plant that behaves more like a food‑feed‑energy complex than a single‑product fuel refinery.
| Co‑Product | Typical Revenue Contribution | Primary Market |
|---|---|---|
| DDGS | 15‑20% of plant revenue | Livestock feed |
| Corn oil | 5‑8% | Biodiesel, feed |
| Captured CO2 | 3‑5% | Food, industrial gas |
| Biogas (heat/power) | Offsets 10‑15% of energy cost | Internal displacement |
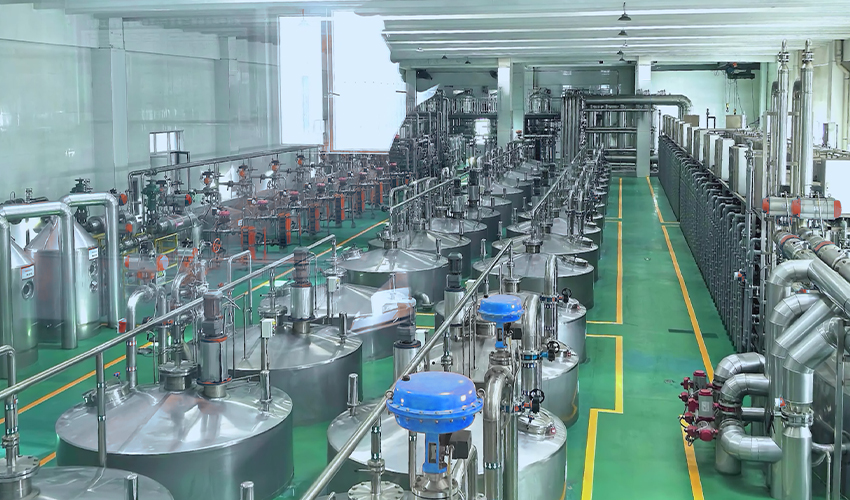
How Energy Integration and Circular Design Lower Carbon and Costs
A plant that runs its distillation columns, dryer, and evaporation system on separate steam loops is leaving energy on the table. Energy cascade design — where high‑temperature steam is used first in distillation, then lower‑temperature heat is recovered for evaporation and drying — can cut thermal energy consumption by roughly a quarter. Coupled with biogas firing, a plant can push its fossil energy input low enough to achieve a CI score in the 20s, far below the industry average.
Water integration runs on the same principle. Closed‑loop systems that treat and recycle process water reduce both freshwater withdrawal and wastewater treatment load. In the integrated alcohol projects we deliver, we aim for 100% by‑product resource utilization: corn becomes fuel ethanol, DDGS, corn oil, and CO2; process water is treated and recycled; and biogas from anaerobic digestion offsets natural gas demand. It is the circular economy model of corn‑food‑energy‑feed embodied in a single site.
This is not an idealized vision. It is the operating reality at plants that committed to circular design at the FEED stage. Retrofitting a conventional plant to this level of integration is possible but always costs more and disrupts production more than building it in from the start. For greenfield projects, the incremental capital for full integration pays back through co‑product revenue and carbon credit within the first few operating years.
Top Strategic Moves for Ethanol Producers in 2026
If the plant’s design locks in its margin structure, then 2026 is the year to make design decisions that anticipate 2030 regulations. Three moves stand out.
First, move from an ethanol‑centric P&L to a biorefinery model that tracks CI score, co‑product margins, and energy intensity as co‑equal KPIs. Second, secure low‑CI feedstock supply contracts with documented farming practices; corn sourced from no‑till and cover‑crop operations can reduce the CI score by a meaningful margin. Third, evaluate technology partnerships that bring an integrated engineering approach. A partner that understands grain storage, corn processing, alcohol production, and co‑product recovery end‑to‑end can reduce the number of interfaces and the integration risk on a project.
The ethanol industry is not standing still. The plants that lock in single‑product assumptions today will find themselves competing against biorefineries with fundamentally better unit economics and stronger carbon compliance profiles.
What the Shift to Biorefining Means for Your Next Project
The margin advantage in 2026 and beyond belongs to plants that treat CO2, DDGS, corn oil, and biogas as revenue streams and not waste. Tightening carbon standards mean that every design decision — from steam system configuration to stillage handling — carries both an operating cost and a CI consequence. For a new build or a major expansion, the feasibility analysis should model not just ethanol revenue but the full biorefinery cash flow under multiple carbon‑price scenarios.
If you are planning a corn ethanol facility or upgrading an existing one, send your project specifications and throughput targets to [email protected]. Our engineering team can run a preliminary analysis comparing a conventional design against an integrated biorefinery configuration for your site conditions and local feedstock costs. You can also reach us at 010-8591 2286 to discuss what a fully integrated plant would look like for your specific program.
Common Questions About Ethanol Industry Trajectory
What is the single most important trend shaping ethanol plant profitability in 2026?
The convergence of carbon intensity regulation and co‑product revenue. A plant that achieves a low CI score can sell into premium markets and capture tax credits; a plant that monetizes DDGS, corn oil, and CO2 effectively widens its margin enough to absorb corn price volatility. The two forces together are separating high‑performing plants from break‑even operations.
Does carbon intensity scoring really change how a plant is designed?
It depends on the target CI. If a project aims for a CI score competitive in California LCFS or EU markets, then process energy source matters fundamentally. Replacing natural gas with biogas, designing for electric reboilers powered by renewable electricity, or capturing CO2 for sequestration all affect the layout and capital cost. Plants built without CI‑aware design will likely need expensive retrofits later.
Which co‑product offers the fastest payback for a new ethanol plant?
DDGS typically delivers the fastest revenue because the market is large and liquid, but the payback on CO2 capture has shortened considerably. In regions with food‑grade CO2 demand or utilization credits, a CO2 recovery and purification package can pay back in under three years. Corn oil extraction also adds a steady revenue stream and the equipment is relatively low‑cost.
In our projects, we have seen that the biggest mistake is modeling the plant based on ethanol revenue alone.
The first‑year economics can look acceptable when corn is cheap and fuel prices are high, but the long‑term viability depends on co‑product income and low carbon intensity. I consistently advise clients to run a full biorefinery cash‑flow model before fixing the plant configuration.
How long does it take to transition from a standalone ethanol facility to an integrated biorefinery?
For a greenfield project, the same timeline as building an ethanol plant — roughly 24 to 36 months from engineering to commissioning — because integration is designed in from the start. Retrofitting an existing plant is more complex; adding CO2 capture or biogas can be done during scheduled turnarounds, but integrating energy systems often requires a partial rebuild and can take 12 to 18 months. Starting with an integrated design eliminates these later disruptions. Share your project timeline and production scale with our team, and we can outline a phased implementation approach that balances operational continuity with biorefinery integration.
If you’re interested, check out these related articles:
Driving Global Food Conservation Through Technological Innovation