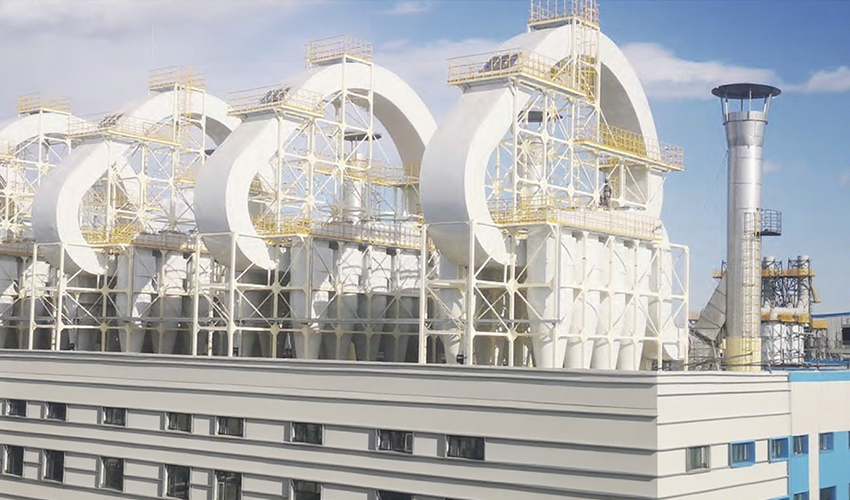

Most discussions around corn processing still orbit ethanol yields and starch conversion rates. That focus misses the larger financial equation. In a modern corn processing plant, the byproduct streams can collectively rival the revenue of primary ethanol production when the facility is designed from the start to capture them. Over years of planning integrated corn processing chains across multiple regions, I have seen projects where the byproducts funded the entire expansion capital within three years. The key is treating these streams not as leftovers, but as product lines with their own quality controls, market specifications, and margin targets.
The Byproduct Portfolio in Corn Processing
A corn kernel entering a processing facility can yield more than a dozen distinct outputs. The ethanol distillation front end produces distillers grains, stillage, and carbon dioxide. The wet fractionation side generates corn oil, corn gluten meal, corn gluten feed, and corn steep liquor. Dry milling plants produce distillers dried grains with solubles (DDGS) and modified wet distillers grains. Each stream has a different market profile, pricing structure, and end-user requirement.
The table below outlines the primary byproducts and their typical end markets. Actual prices fluctuate with regional commodity markets, but the relative value tiers hold across most geographies.
| Byproduct | Typical Yield (per bushel) | Primary End Market | Approximate Value Premium vs. Raw Corn |
|---|---|---|---|
| DDGS | 5.2–5.5 lbs (dry mill) | Livestock feed (beef, dairy, poultry) | 0.8–1.2× |
| Corn Oil | 0.5–0.6 lbs (dry mill extraction) | Biodiesel, food-grade vegetable oil | 2.5–4.0× |
| CO₂ (liquid) | 0.49–0.54 lbs theoretical recovery | Food carbonation, industrial gas | 1.5–3.0× (post-purification) |
| Corn Gluten Meal (60% protein) | 2.5–2.8 lbs (wet mill) | Poultry feed, pet food, aquaculture | 1.8–2.5× |
| Corn Gluten Feed (21% protein) | 5.2–5.8 lbs (wet mill) | Cattle feed | 0.6–0.9× |
| Corn Steep Liquor | 3.0–3.5 lbs (wet mill) | Fermentation nutrient, animal feed | 0.7–1.1× |
These figures are for a facility operating at design capacity with tight process control. In projects I have worked on, even a 5% loss in DDGS protein content due to overdrying can reduce the selling price by 8–12% in competitive feed markets. The margins in byproducts are thinner than they appear on a volume basis, so process consistency directly dictates revenue.
DDGS and the Feed Market as the Largest Volume Revenue Stream
DDGS remains the dominant byproduct revenue line for any dry-mill ethanol plant. The global feed protein deficit, projected to widen through 2030, keeps demand structurally high. But not all DDGS is equal. The protein content, typically 26–30% on a dry matter basis, varies with the corn feedstock and the fermentation efficiency. Higher ethanol conversion yields consume more starch, concentrating the protein in the residual solids. That relationship creates a built-in trade-off: higher ethanol output often means better DDGS quality.
From a market perspective, the export window for DDGS is just as critical as domestic livestock demand. China, Southeast Asia, and Mexico are large importers, and their phytosanitary and GMO regulations can shift suddenly. A plant that has secured multiple destination approvals and can flex between containerized and bulk export has a meaningful advantage over one selling exclusively to local feed mills.
If your project involves significant DDGS volume heading into export markets, confirming the required certifications and destination-country registration timelines before commissioning will avoid months of inventory accumulation. Reach out at [email protected] to discuss how to build that compliance timeline into the project schedule.
Corn Oil Extraction Adds a High-Value Layer
Corn oil extraction, now standard on most dry-mill plants built after 2010, pulls roughly 0.5 to 0.6 pounds of crude corn oil per bushel. After further refining, that oil can go into biodiesel or, with additional purification, into food-grade applications. The biodiesel market values corn oil based on its carbon intensity score under renewable fuel standards. Food-grade corn oil commands a higher and more stable price, but requires deodorization and winterization equipment that adds capital cost.
The decision to invest in food-grade purification rather than selling crude oil to a third-party refiner depends entirely on the plant’s scale and its proximity to food oil bottling or industrial food manufacturing customers. For a 50-million-gallon ethanol plant, the annual crude corn oil output is roughly 25–28 million pounds. Upgrading to food-grade can increase the per-pound margin by $0.08–0.15, which translates to an additional $2–4 million per year in gross profit. The capital equipment for refining, however, often falls in the $5–8 million range, meaning the payback period runs three to five years. That math shifts dramatically with plant scale, and it is one of the more frequent evaluation points I see project sponsors underestimate during feasibility.
Capturing CO₂ and Biogas: Emissions as Revenue Centers
The fermentation process generates approximately 0.50 pounds of CO₂ per pound of ethanol produced. A 50-million-gallon plant theoretically generates 125,000–130,000 metric tons of CO₂ annually. Capturing, scrubbing, compressing, and liquefying that CO₂ for the food and beverage market demands a separate purification train, but the payback has become very attractive as the merchant CO₂ market has tightened.
Beyond CO₂, anaerobic digestion of thin stillage or wastewater can produce biogas that replaces a significant portion of the plant’s natural gas consumption. A well-designed digester system can offset 15–25% of the plant’s thermal energy demand, which on a 50-million-gallon plant equates to roughly $1.5–2.5 million per year in avoided fuel cost. The synergy with CO₂ capture is that biogas combustion also generates a concentrated CO₂ flue gas that can be further purified, creating an integrated carbon recovery loop.
Designing the Plant for Full Byproduct Value from Day One
The single biggest factor determining byproduct revenue is not the market price; it is whether the plant layout and process flow were designed to accommodate full byproduct processing from the start. Plants retrofitted with corn oil extraction, CO₂ capture, or anaerobic digestion typically spend 30–50% more on integration costs than plants that included those systems in the original FEED package.
AGRIFAM’s integrated corn processing approach embeds the byproduct processing infrastructure into the core plant design. The alcohol solution we provide incorporates energy cascade utilization, comprehensive biogas recovery, and wastewater treatment within a single closed-loop system. That integration avoids the piecemeal capital spending that erodes the economic advantage of byproduct recovery. Over multiple projects, we have seen that plants with fully integrated byproduct systems achieve a 100% byproduct resource utilization rate, meaning every process output finds a commercial pathway.
For a new project at the feasibility stage, the most important step is to model the byproduct revenue streams alongside the primary ethanol projections, not as a separate afterthought. The financial model should include market price forecasts for each byproduct, sensitivity analysis on protein and oil prices, and capital cost curves for the purification equipment. These models define the true project ROI far more accurately than ethanol price assumptions alone.
Common Questions About Corn Processing Byproducts
What is the most profitable byproduct from a corn ethanol plant?
It depends entirely on the market access and the plant’s purification capability. On a per-pound basis, food-grade corn oil typically delivers the highest margin, but DDGS dominates total revenue because of volume. In a plant with CO₂ capture, the net margin on CO₂ can be higher than both on a per-unit basis, but volume is limited by fermentation output. In the plants I have evaluated, I usually assign DDGS as the largest absolute contributor and corn oil as the highest margin contributor, with CO₂ acting as a high-return but volume-constrained third stream.
Why do some plants not recover CO₂ if the payback looks good?
CO₂ recovery requires a dedicated liquefaction plant, which costs $5–10 million depending on capacity and purity requirements. Additionally, the merchant CO₂ market is regionally concentrated: if the nearest food-grade CO₂ buyer is 300 miles away, transportation cost can eat the margin. Plants located near dense beverage or industrial gas markets have a strong advantage, while remote plants may find the capital better deployed elsewhere.
How do byproduct revenues affect the overall project payback period?
Based on project data I have reviewed, including integrated plants where byproduct processing was part of the original design, the payback period can shorten by 1.5 to 2.5 years compared to a plant that sells wet distillers grains and crude corn oil with no further processing. That reduction comes from both higher per-unit revenue and lower waste disposal costs. In one configuration we modeled, the byproduct revenue streams covered the debt service on the entire plant within the first three years of operation, with ethanol revenue driving the remaining equity returns.
Are there markets for corn processing byproducts beyond animal feed?
Yes. DDGS can be fractionated into protein and fiber fractions for use in aquafeed and pet food. Corn oil can go into bioplastics and oleochemicals. Corn gluten meal is used in fish feed formulations and as a natural herbicide in organic farming. The byproduct market map continues to expand as feed manufacturers and industrial users seek alternatives to soy and fossil-based inputs. Share your specific target applications and we can confirm what purity specifications and certifications your project will need to meet those buyer requirements. Email [email protected] or call 010-8591 2286.
Each corn processing facility sits at the center of a web of potential revenue streams that, together, can exceed the earnings from fuel ethanol. The plants that realize that value are the ones designed from the outset to treat every output as a product, not a disposal challenge. Whether the path involves DDGS export certification, food-grade corn oil refining, or integrated CO₂ and biogas recovery, the project economics improve most when the byproduct strategy is built into the plant architecture, not bolted on later.
If you’re interested, check out these related articles:
Driving Global Food Conservation Through Technological Innovation